Modeling
This option of the H-TEST tool allows the user to manage UML diagrams. It will also be able to manage the data and manage the repositories of the test cases that are designed.
UML Diagram
This option of the H-TEST tool allows the user to manage all treatments associated with UML diagrams.
How to create an UML diagram
UML diagrams are completely necessary for the creation of the test cases. That is because every message of the diagram represents an action that will be carried on in the test (click or type, for instance). In the next paragraphs, it is explained how can an UML diagram be created.
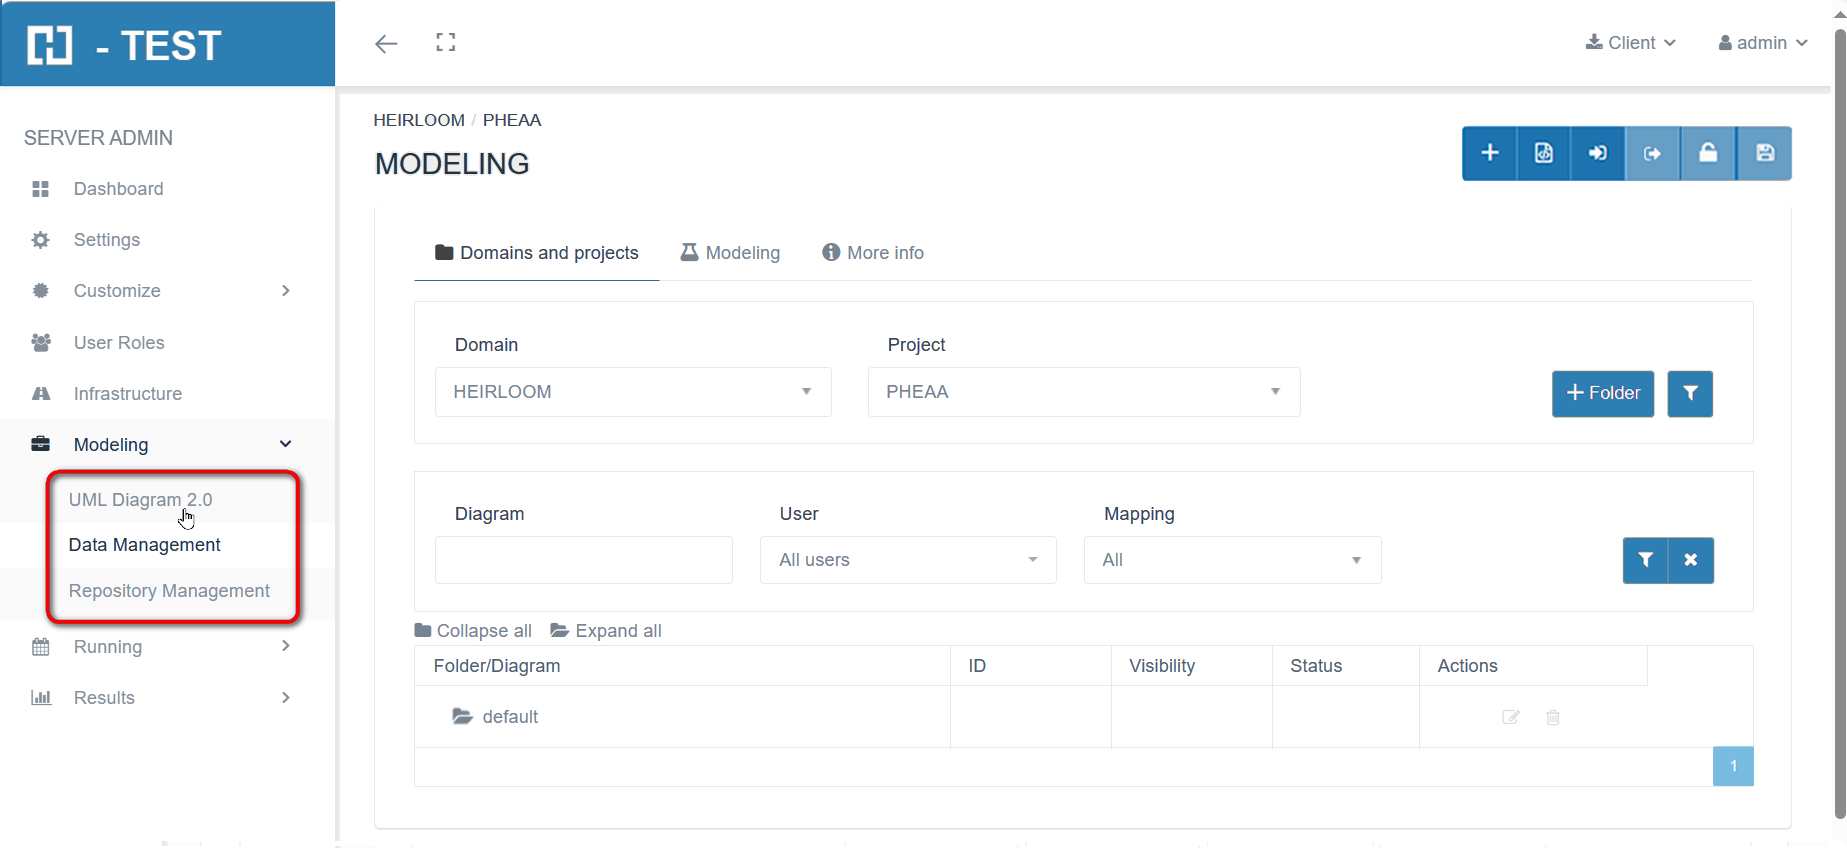
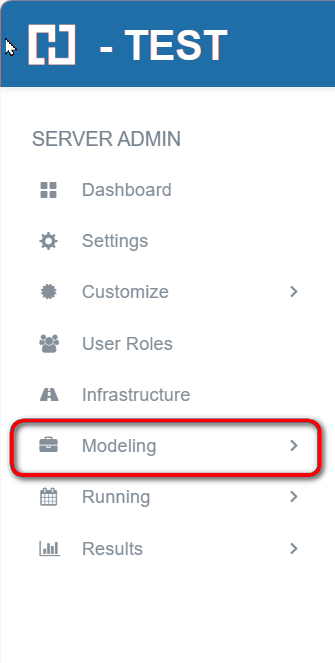
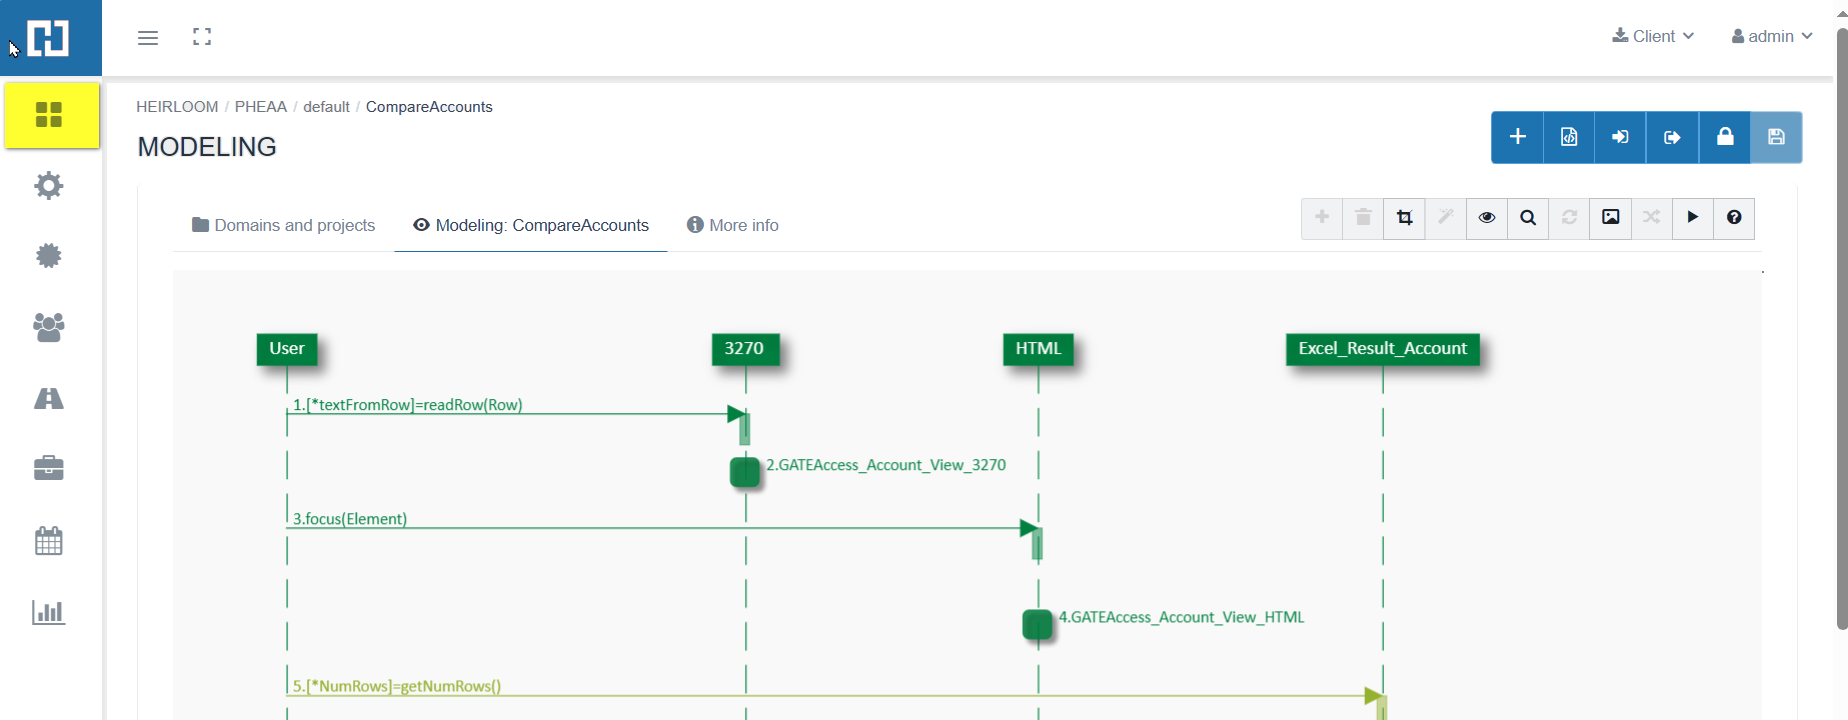
When logged in the tool, the user can see a menu in the left side (see First-steps-in-H-TEST for further info). In this menu, the user will click on the button “Modeling”.
Once in the Modeling page, the user can proceed in three ways:
-
Selecting and modifying one of the test cases already created.
-
Creating a new test case.
-
Importing a test case created with any other UML Design tool.
-
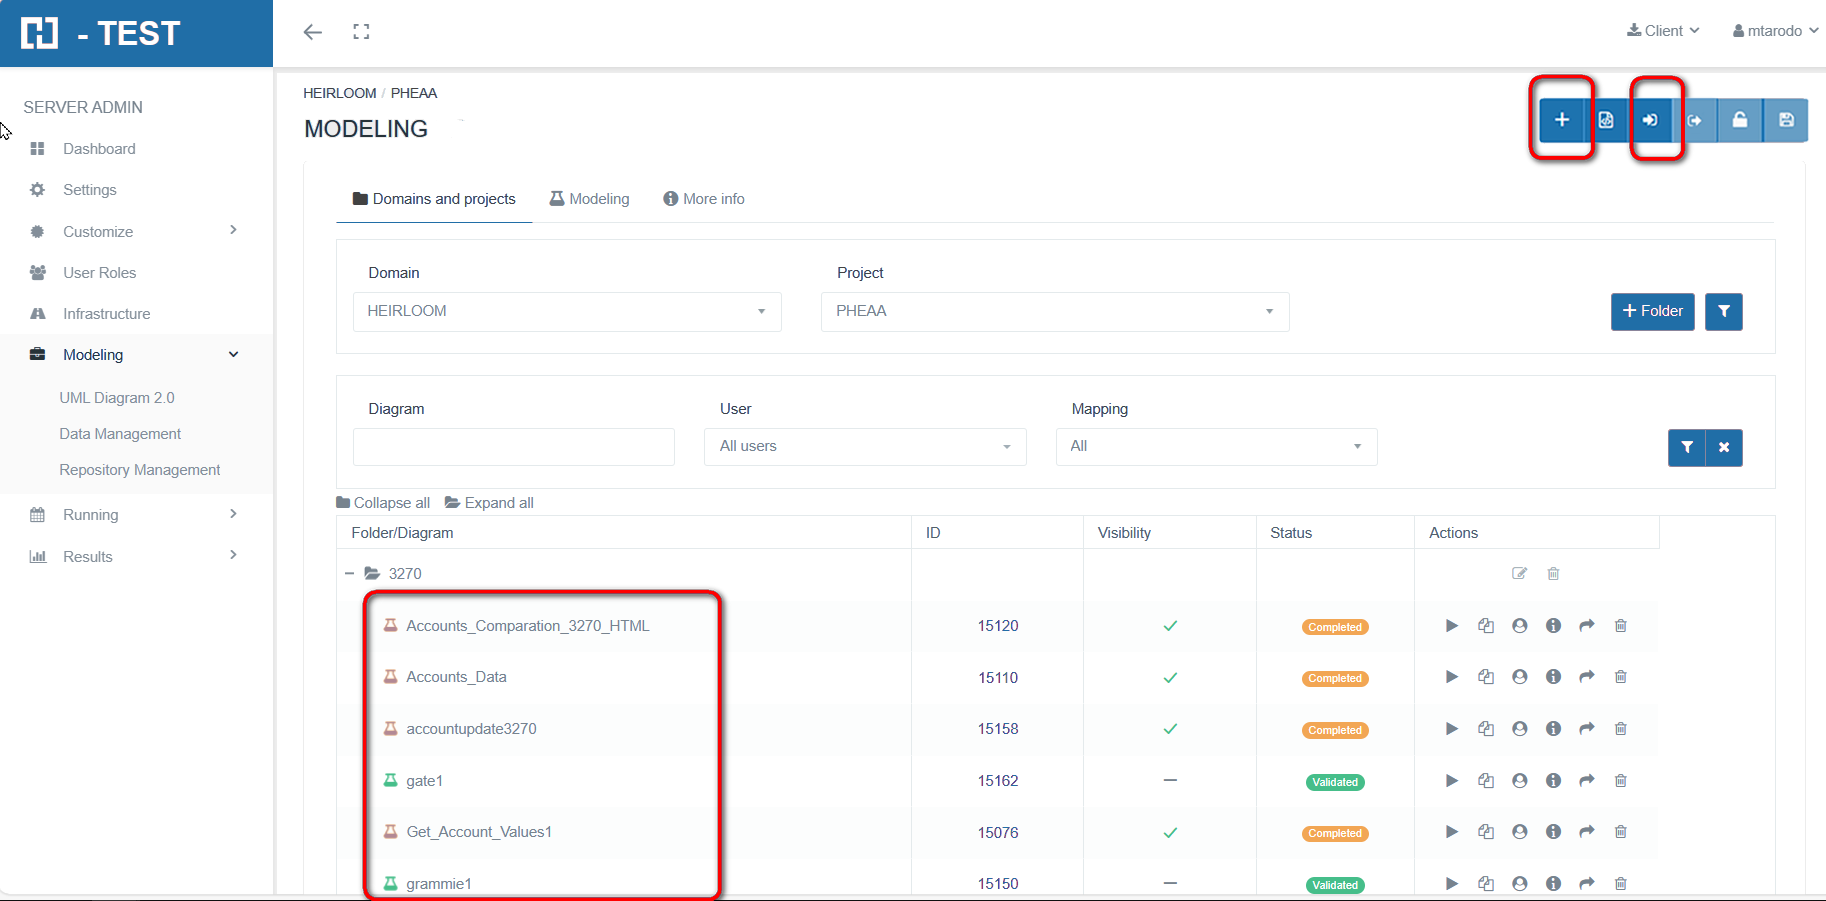
If the user chooses to modify an existing UML diagram (left side of the upper screenshot), there will be 4 different colors for the test cases:green for cases where the mapping has been completed and executed correctly, yellow for cases where the mapping has been completed but not executed, red for cases where the mapping has been completed and executed with error and gray for cases that are empty.
-
When choosing to create a new UML diagram, it is needed to click on the “New diagram” icon (+) in the tab located on the upper right side. After this, a new window will open as shown below:
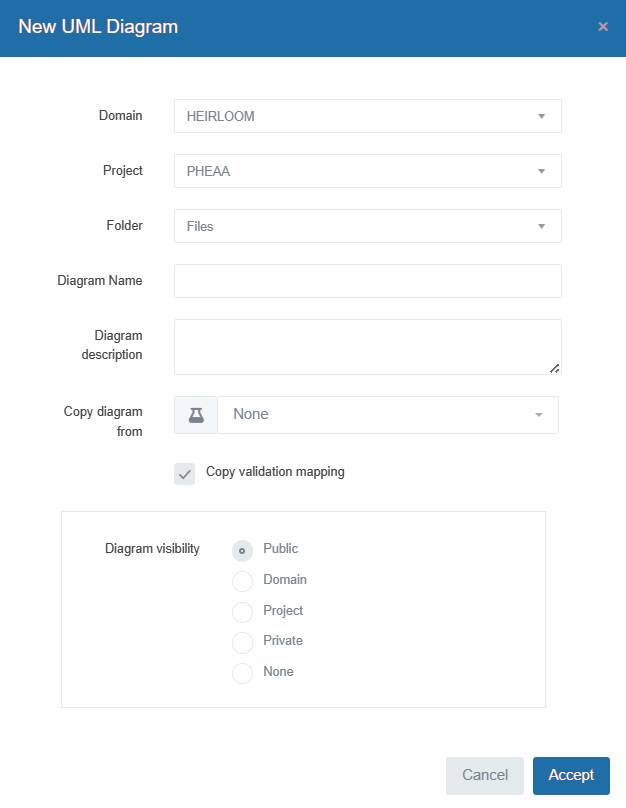
Where you will have to fill in the following fields:
-
Domain: this is the domain which the test case will belong to.
-
Project: select the project where the test case will be linked to.
-
Folder: folder of the system where the test case will be stored.
-
Diagram name.
-
Diagram description.
-
Use diagram template.
-
Copy validation mapping.
-
Visibility as a template:
-
Public.
-
Domain.
-
Project.
-
Private.
-
None.
-
The projects and domains need to be created before the creation of the test case and, also, the user needs to be assigned to the domain and project. Otherwise, the user will not be able to see neither the project-domain, nor the test cases that might have already been created. For more information about domain and user creation, see the Customize-domains-and-projects page.
- If the user chooses to import a test case already created, he will click the “Import” button near the “New diagram” button.
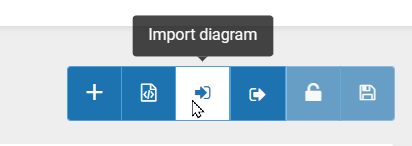
and a new window will open with information on where to save this diagram (see page Import-and-export-of-diagrams).
Edit diagram
This option of the H-TEST tool allows create / modify a diagram.
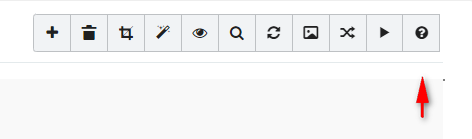
Below we see the screen or canvas to edit a diagram. It is the Canvas 2.0. At the top right (marked in red), is the Canvas toolbar, which offers different options for the design of the diagram. Let's look at them below:
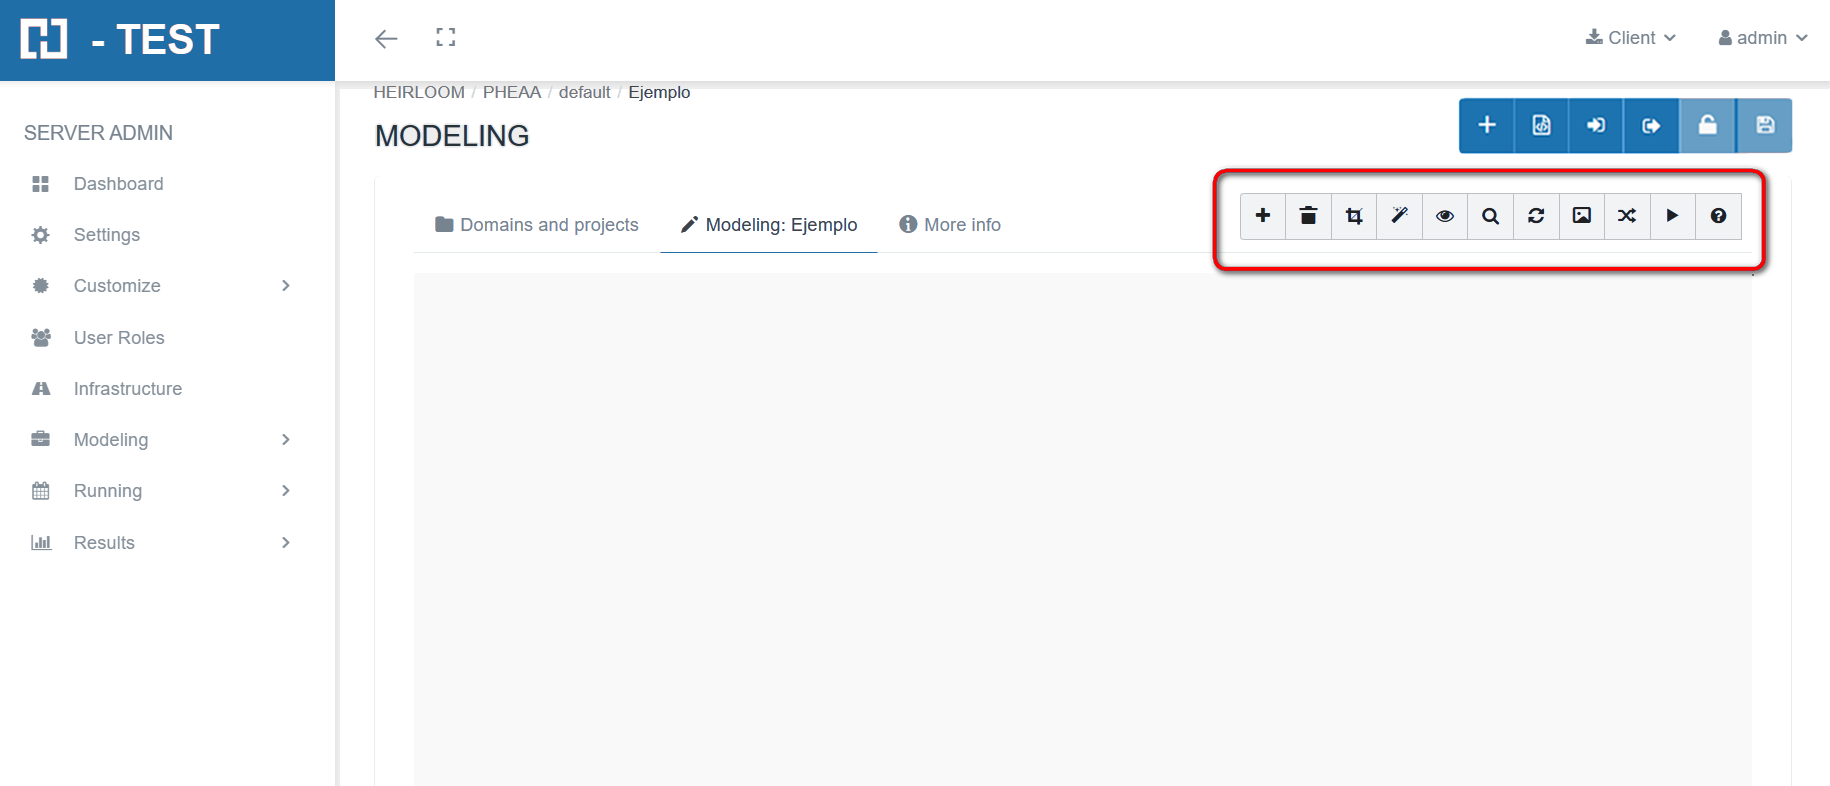
- Select the elements to be included in the diagram by clicking on the '+' icon:
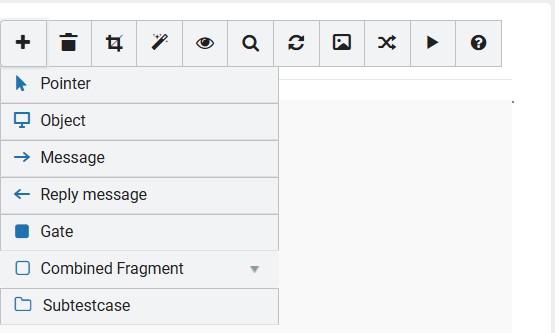
-
Delete elements: allows you to delete the selected diagram object(s) using the 'trash can' icon.
-
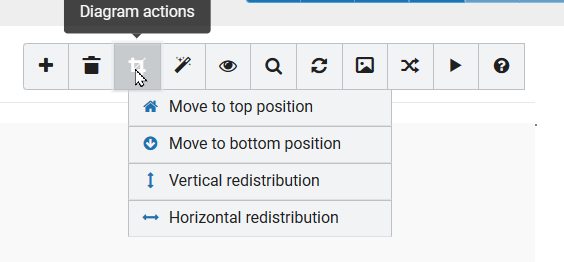
Diagram actions: groups a series of actions that can be performed at the diagram level:
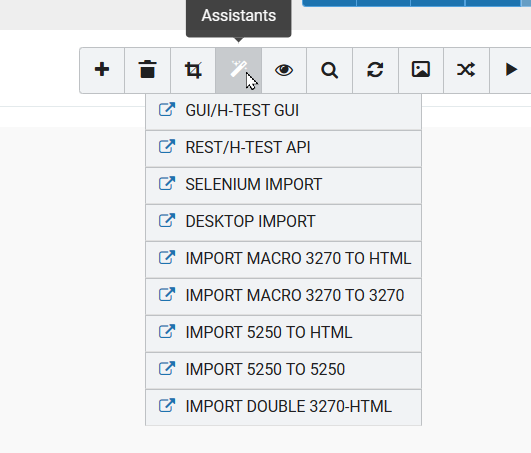
- Assistants: displays a list of available assistants:
-
View diagram map: by clicking this button, a thumbnail of the current diagram (at a scale of 4:1) is displayed in a box at the top right of the Canvas.
-
Magnifying glass: allows you to perform free text searches on all diagram elements, and also allows you to narrow the searches on those elements that interest you at a given moment.
-
Reload repositories: allows us to reload YML or TXT files, which contain a series of keys that we can use in the diagrams.
-
Download diagram image: by clicking on the 'image' icon, an image is generated “on the fly” as the current diagram is, i.e. a preview of the diagram is created and downloaded to a .png file.
-
Validate mapping: validates the mappings included in the diagram using the 'validate mapping' icon.
-
Run validation: runs the validation of the diagram with the 'play' icon.
-
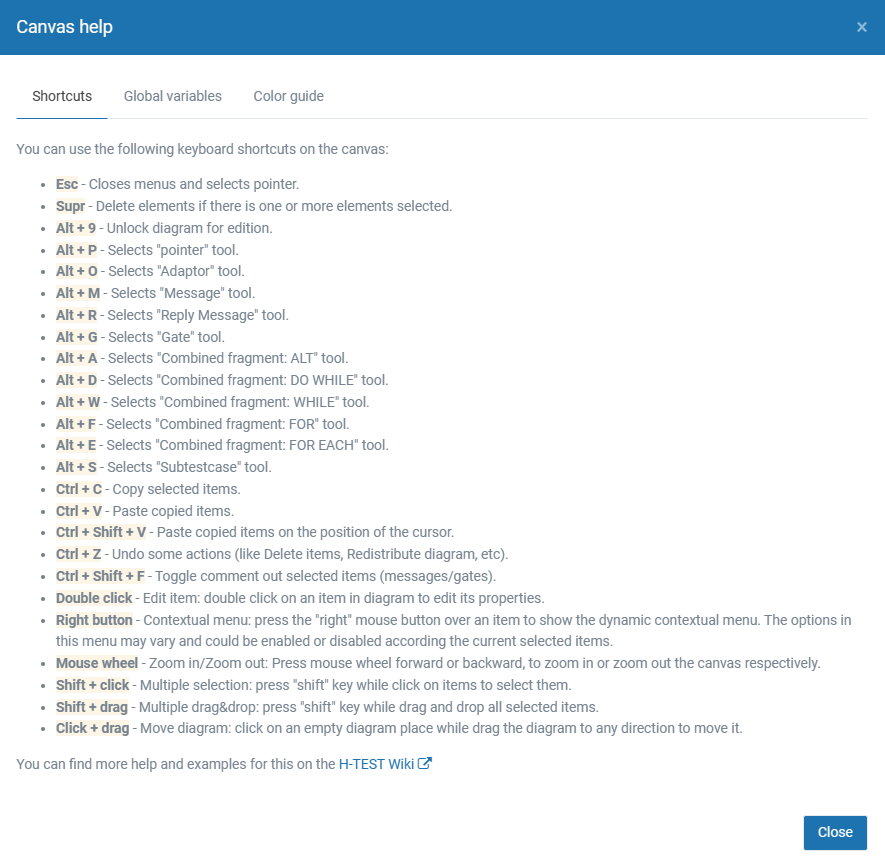
Show Canvas help: a modal appears with 3 tabs (Keyboard shortcuts, Global variables, Color guide) where the basic Canvas help is shown.
-
“Keyboard shortcuts” tab: displays all keyboard shortcuts that are equivalent to actions performed either through menu options or buttons:
-
-
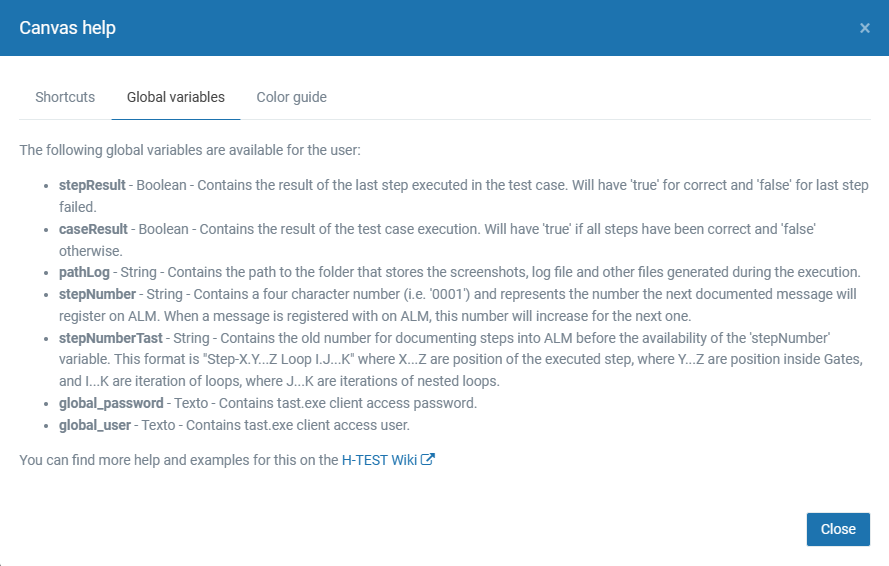
- “Global variables” tab: displays the standard global variables available in any diagram:
-
-
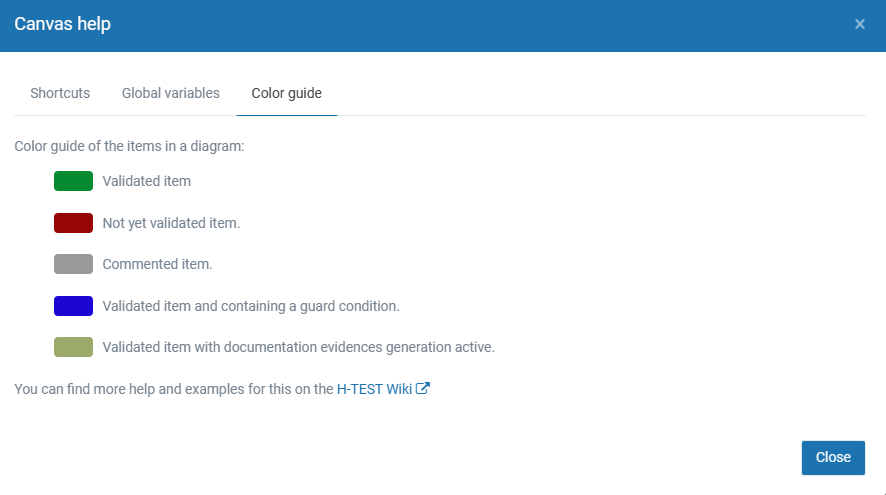
- “Color Guide” tab: refers to the different colors that can now be found on the objects in the diagram.
-
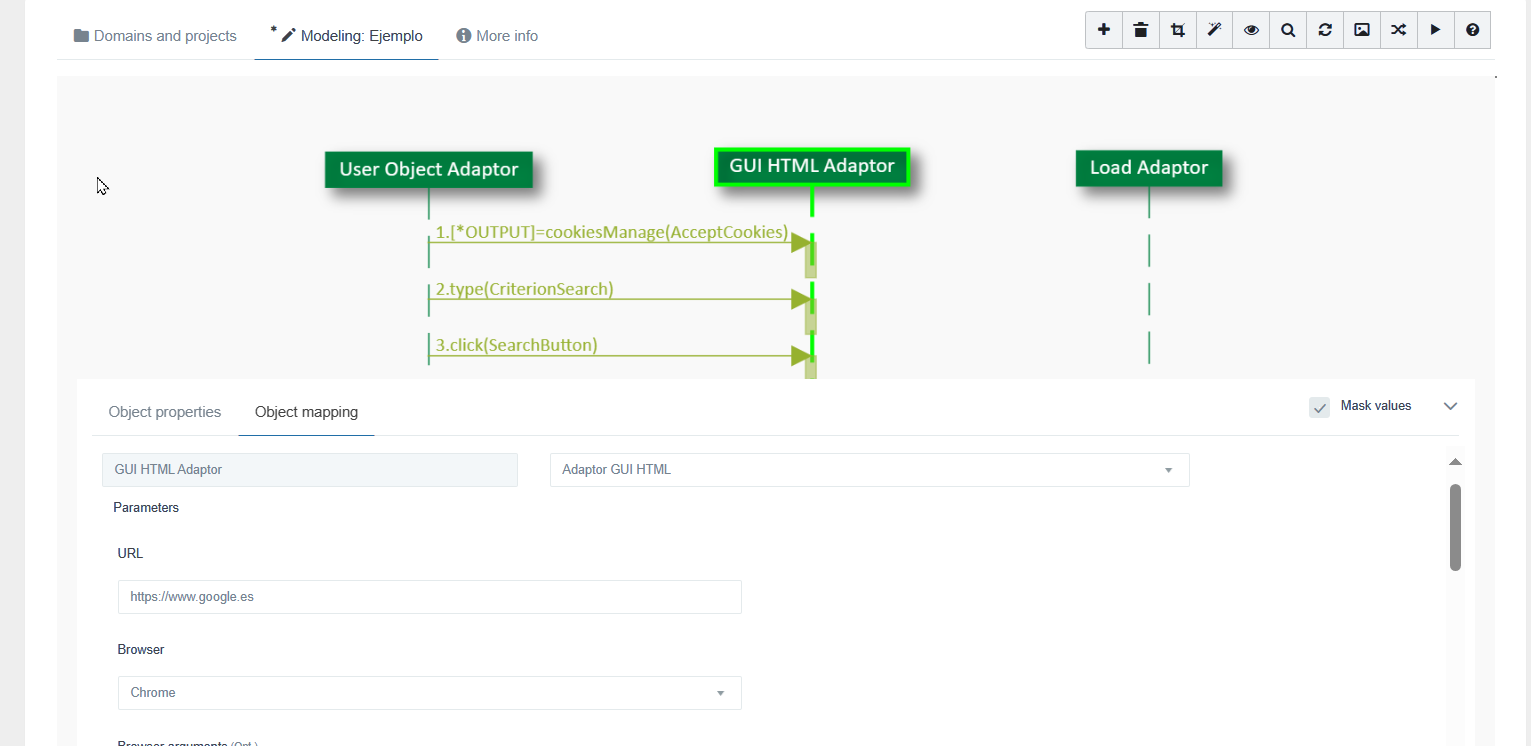
Checking in object properties tab
The object or objects (Adapters), is the main element when creating a diagram. Two tabs help to define the name of the object, its properties and initialization or configuration parameters, to be able to interact with web pages, files, API, scripts, remote, DB.
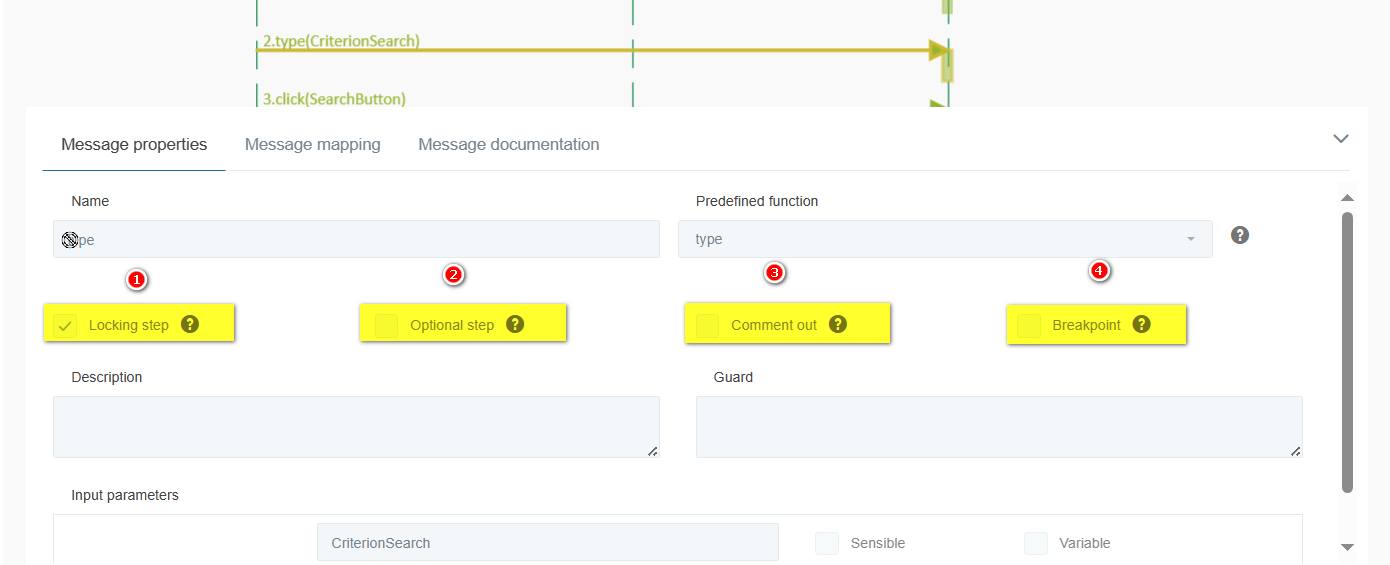
Checking in message properties tab
In a message, by double click over it, is possible to indicate the type of action when the step is executed based on the following checkbox:
-
Locking step: If this message fails, the test execution will stop and the test will end.
-
Optional step: The result of this step will not impact the test result.
-
Comment out: If this check is marked, the message will not be executed.
-
Breakpoint: The breakpoint check is used to stop the execution of the test in this step. It is helpfull during the creation of the diagram.
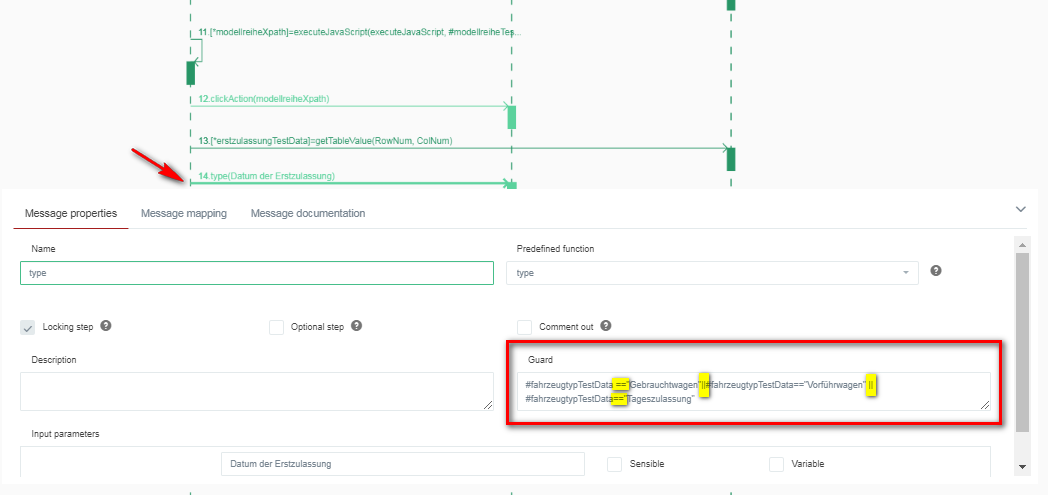
Guards
A guard is a logical condition that can be included in a UML message. The behavior is as follow, when the logical condition is true, the message is executed, when the logical condition is false, the message is NOT executed.
A guard is really useful when an action must or must not be executed, based on the result of a condition.
The conditions inside a guard can be of two types:
-
Simple, by using logical operators like, < (less than), > (greater than), == (equal to), != (different than), ⇐ (less or equal to), >= (greater or equal to).
-
Complex, by concatenating the use of simple operators through logical operators as: AND (and), OR (or), && (exclusive and), || (exclusive or)
Following some examples about simple and complex conditions in a Guard:
-
#numCol < 25
The message will be executed when, the variable numCol is less than 25.
-
#myFavoriteApp == “H-TEST”
The message will be executed when the variable myFavoriteApp is equal to the string “H-TEST”. To be considered that the strings must be compared using “” (double coutes).
-
#fahrzeugtypTestData ==“Gebrauchtwagen”||#fahrzeugtypTestData==“Vorführwagen” || #fahrzeugtypTestData==“Tageszulassung”
The message will be executed when the variable fahrzeugtypTestData, is equal to one of the following values: Gebrauchtwagen, Vorführwagen, Tageszulassung.
-
#str1 ==“H-TEST” AND #str2==“TaaS” AND #str3==“SIPSA”
The message will be executed when the variable string str1 is equal to H-TEST and when the variable str2 is equal to TaaS and when the variable str3 is equal to SIPSA.
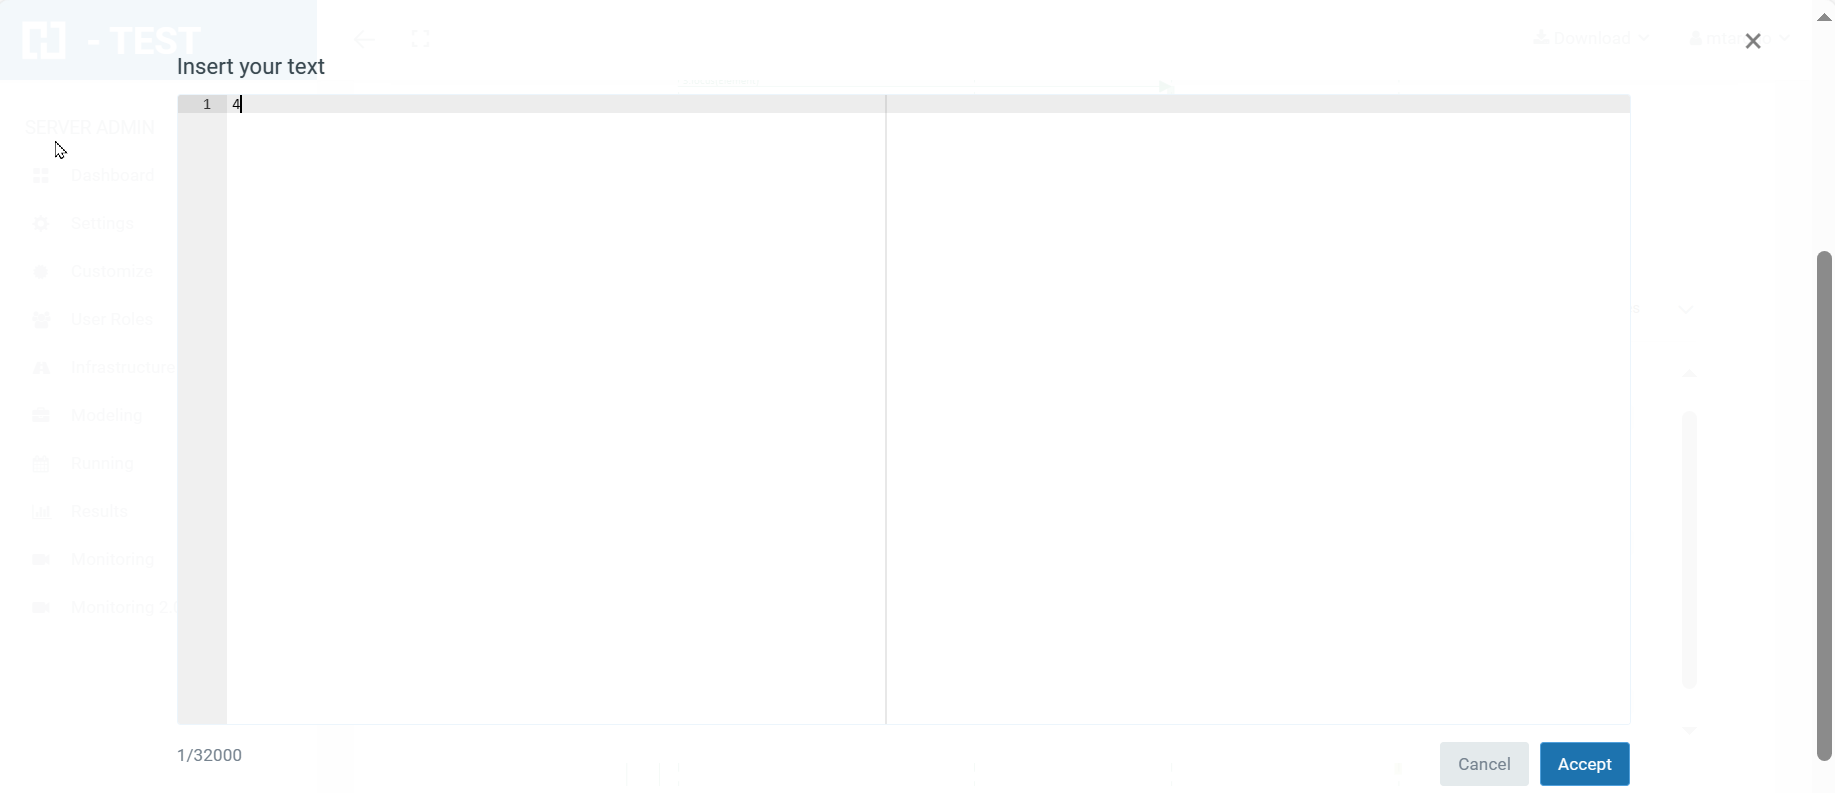
Multiple line text
In the mapping of a message, is possible to include a value with line skipping. For this, there is a checkbox 'Multiline Text':
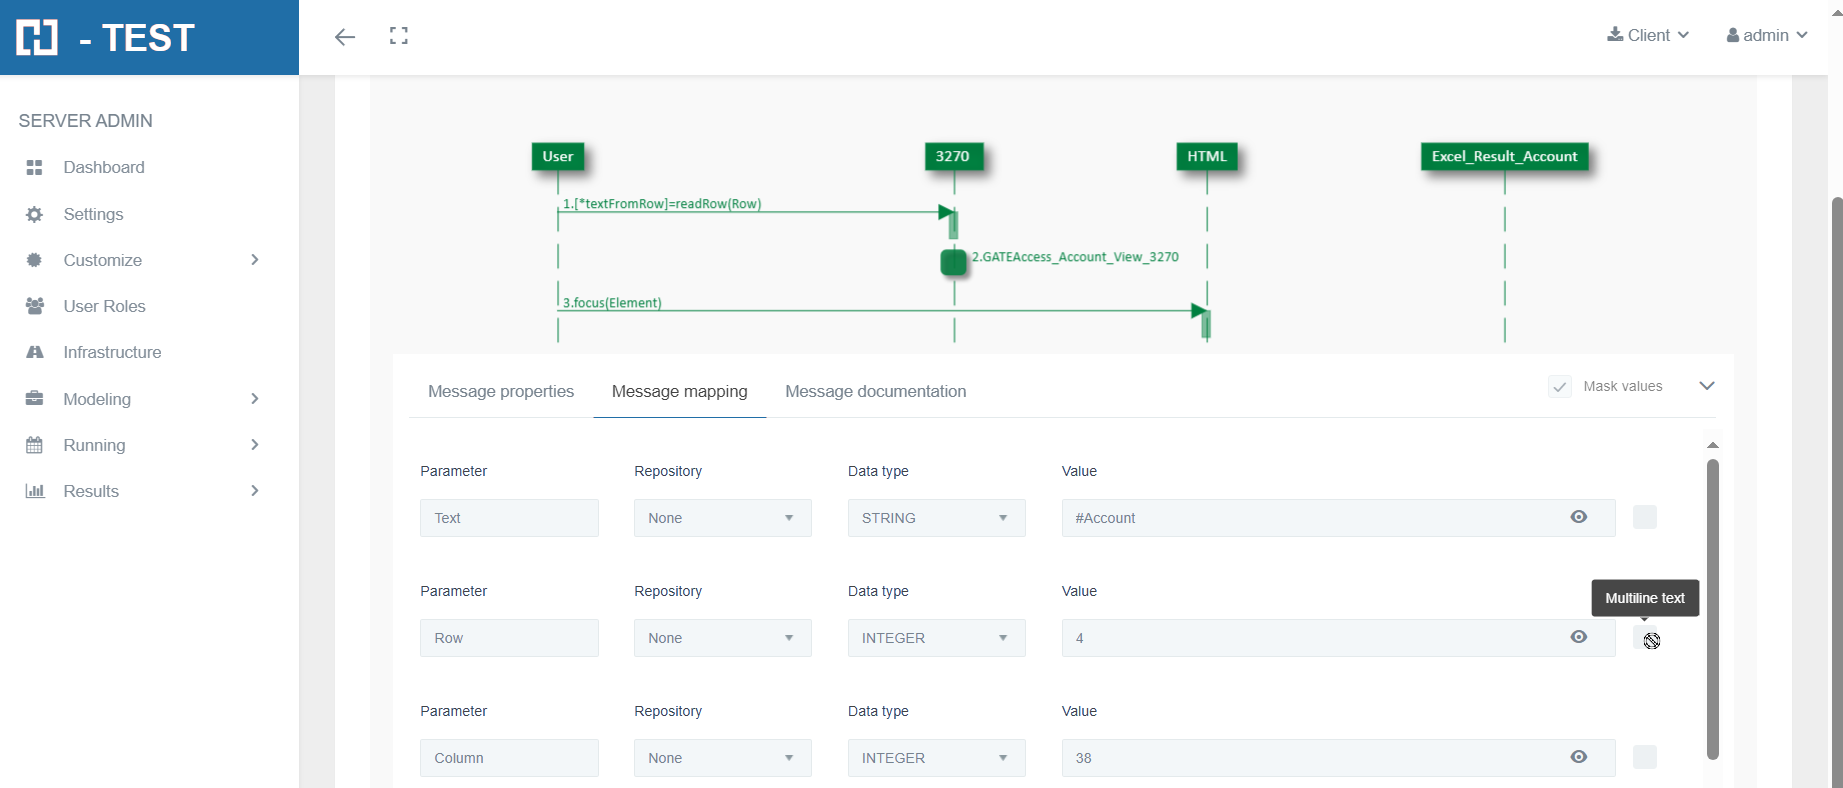
If the checkbox is selected, an editor will appear to include the text:
Reply message
This message has to be tied to another message between two objects and is painted in the opposite direction. The two messages form a set and are not treated separately.
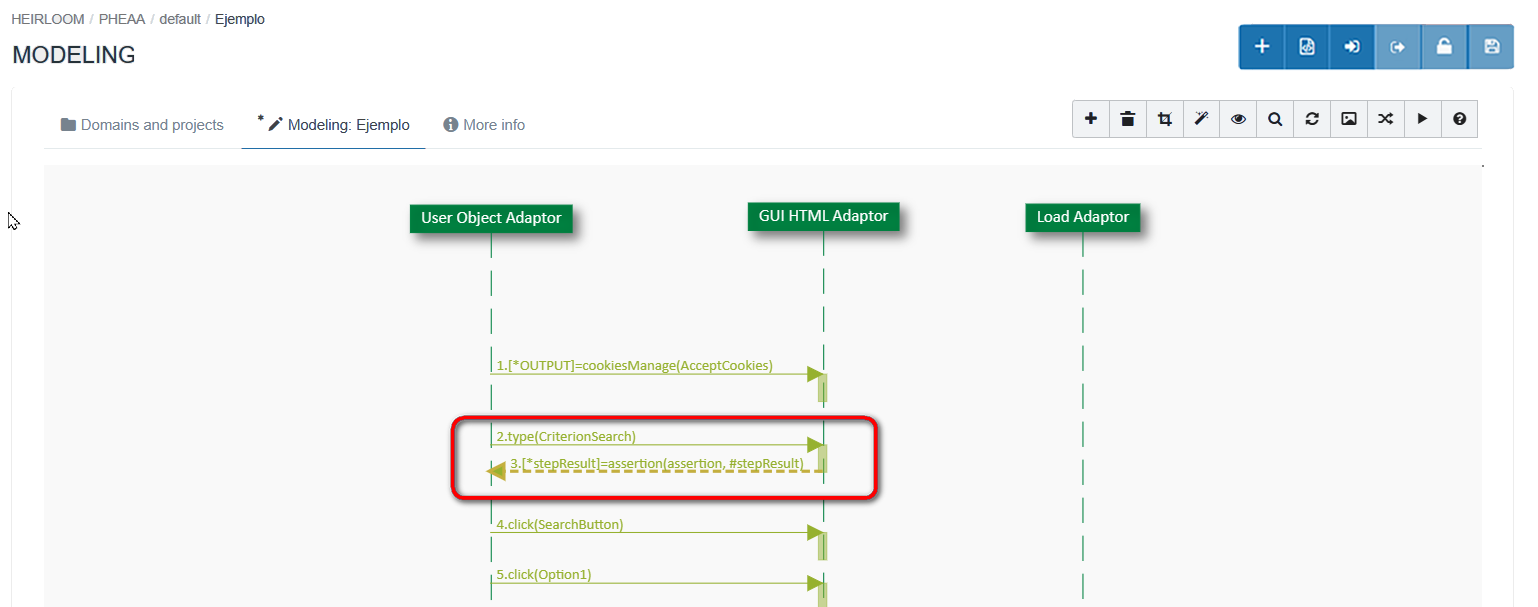
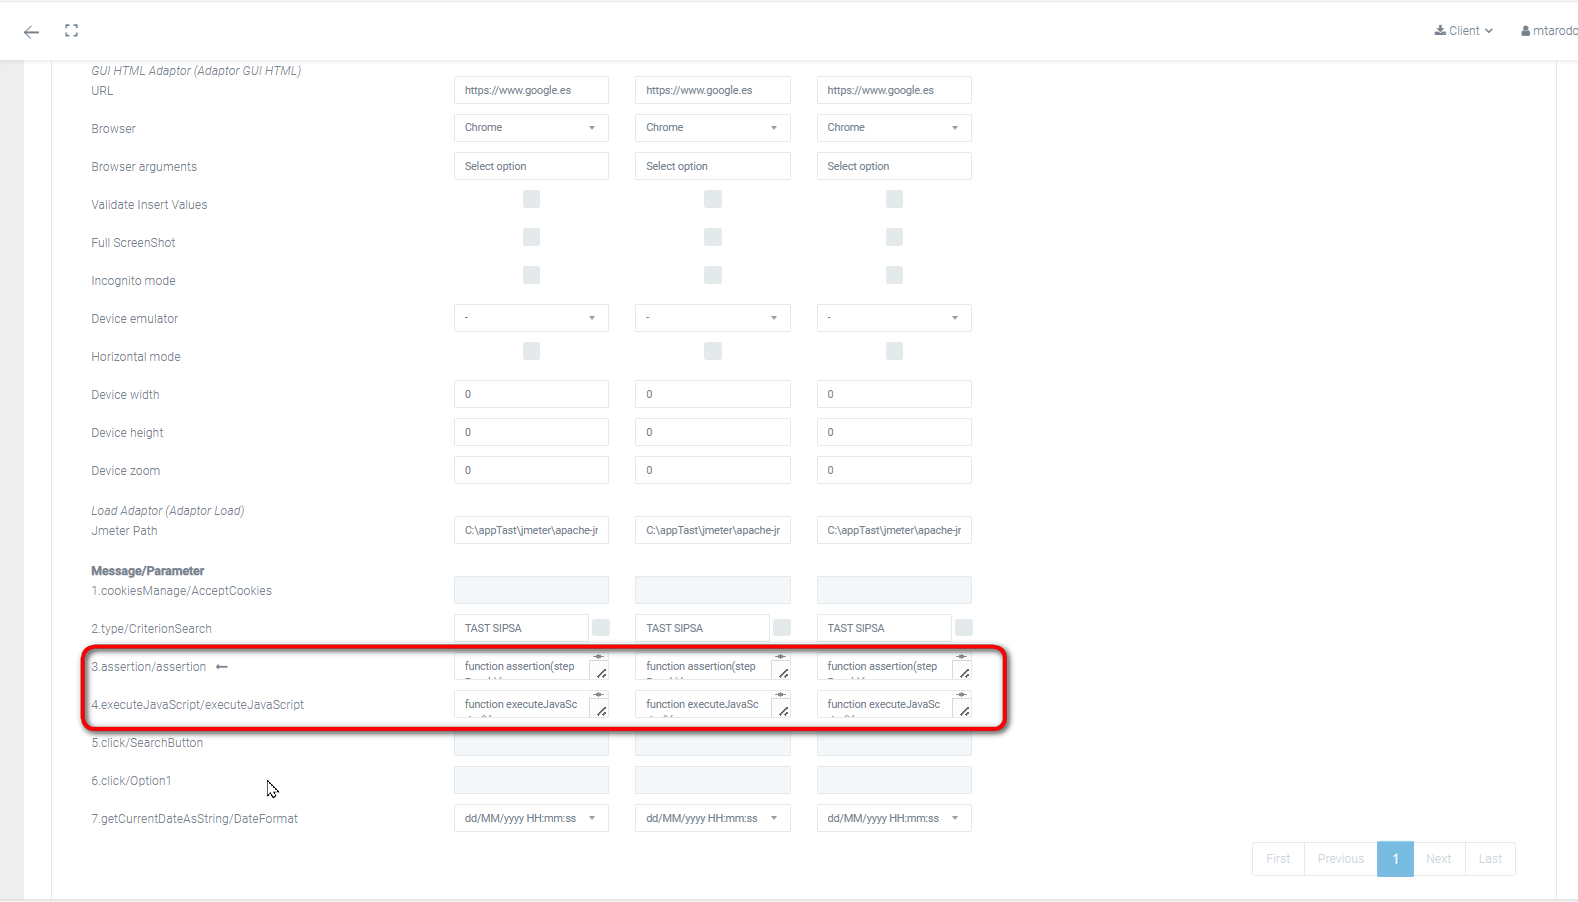
The only function allowed in the reply message is assertion, that has as input parameters stepResult (result of the previous message), and can have more parameters. The output parameter is also stepResult.
-
This message allows us is to vary the result of the previous step by checking some conditions. This process is done using a javascript.
DATA MANAGEMENT: It allows modifying the javascript of each one of the diagrams.
Gates
This option of the H-TEST tool allows the user to pass information between sequence diagrams. Gates can be an easy way to model the passing of information between a sequence diagram and its context. A gate is merely a message that is illustrated with one end connected to the sequence diagram's frame's edge and the other end connected to a lifeline and represents another diagram.
About Gates, please consider the following important topics:
-
The position of the adaptor inside the gate is very important for the correct behavior because the Gate is also related to the Adaptor you plan to instantiate. Thus, you should put the Gate not only in the number step, but also in the same lifeline where you can continue the test execution. For example, if you want to use a Gate to a HTML GUI Adaptor, you should put the Gate in a Lifeline of a GUI HTML Adaptor into the parent diagram.
-
The Isolated behavior always instantiates all adaptors.
-
The Non-isolated behavior: maps the messages of the first adaptor of the Gate that has the same type as the adaptor of the parent where it is drawn; the rest of the adaptors will be instantiated.
-
The concept of Isolated / Non-Isolated is internally configured in H-TEST. Currently, that concept only applies for these adaptors: GUI Adaptor and Web Services Adaptor.
-
For the User's Gates: all the Gates in lifelines belonging to User objects are mapping to the User object of the Father diagram.
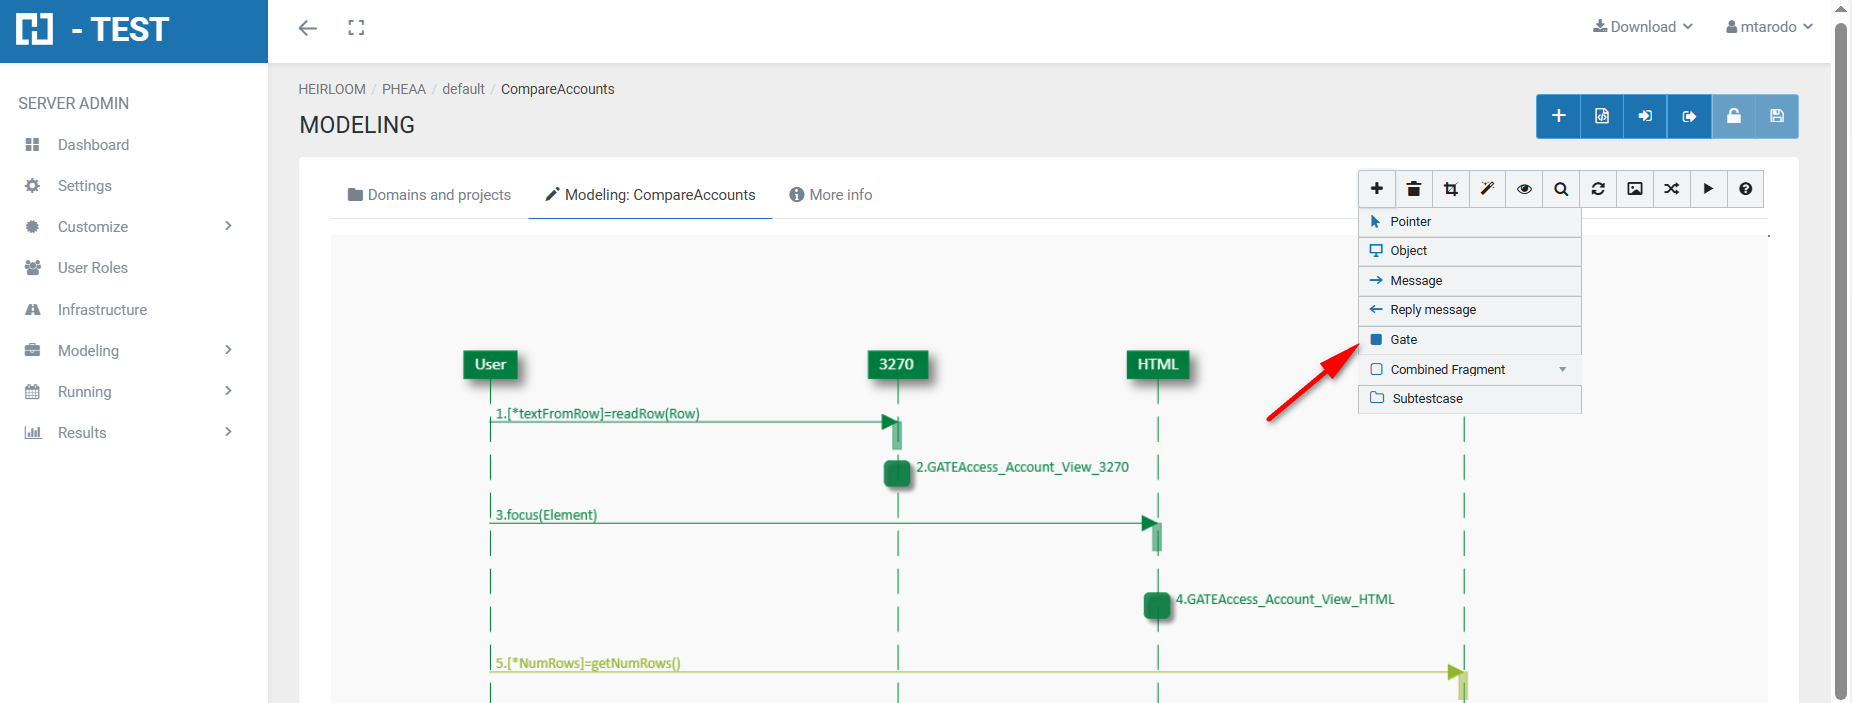
How to Create a Gate:
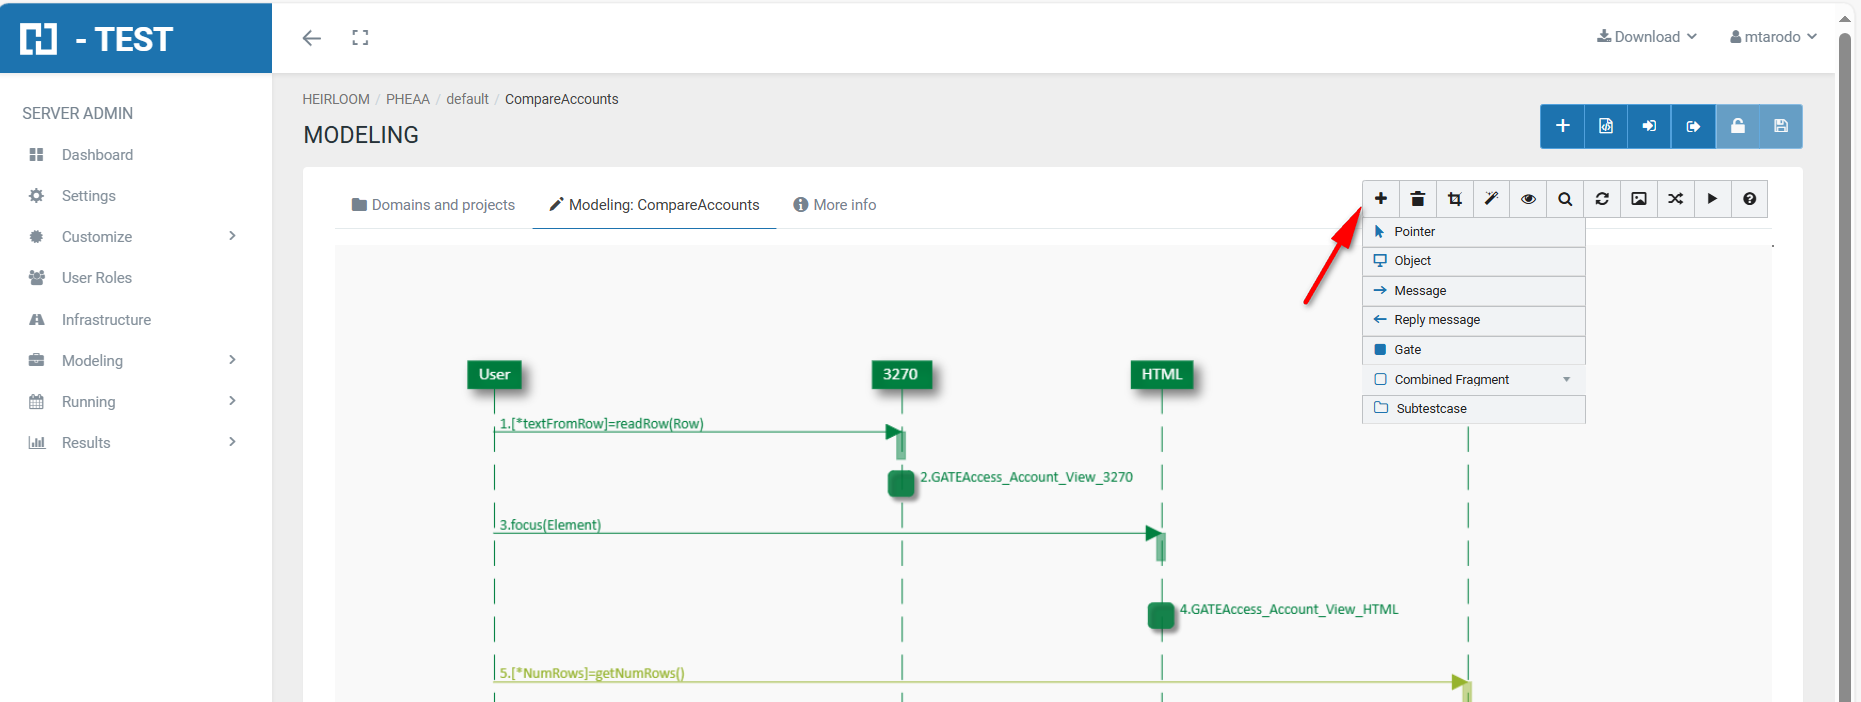
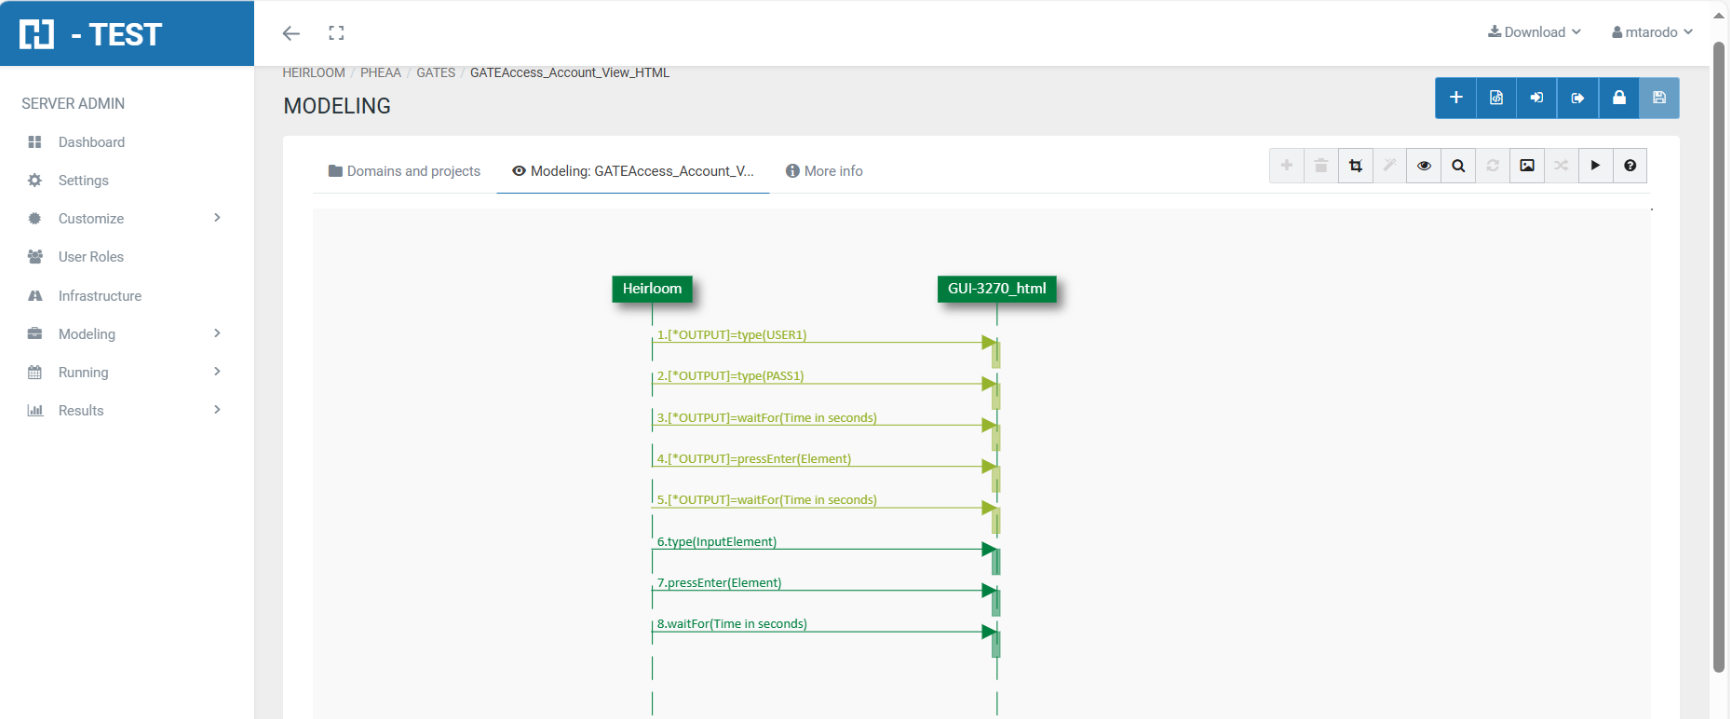
In the toolbar, select the Gate and draw on the lifeline. Double click and open the Gate properties, where you choose the domain, the project and the diagram you want to copy.
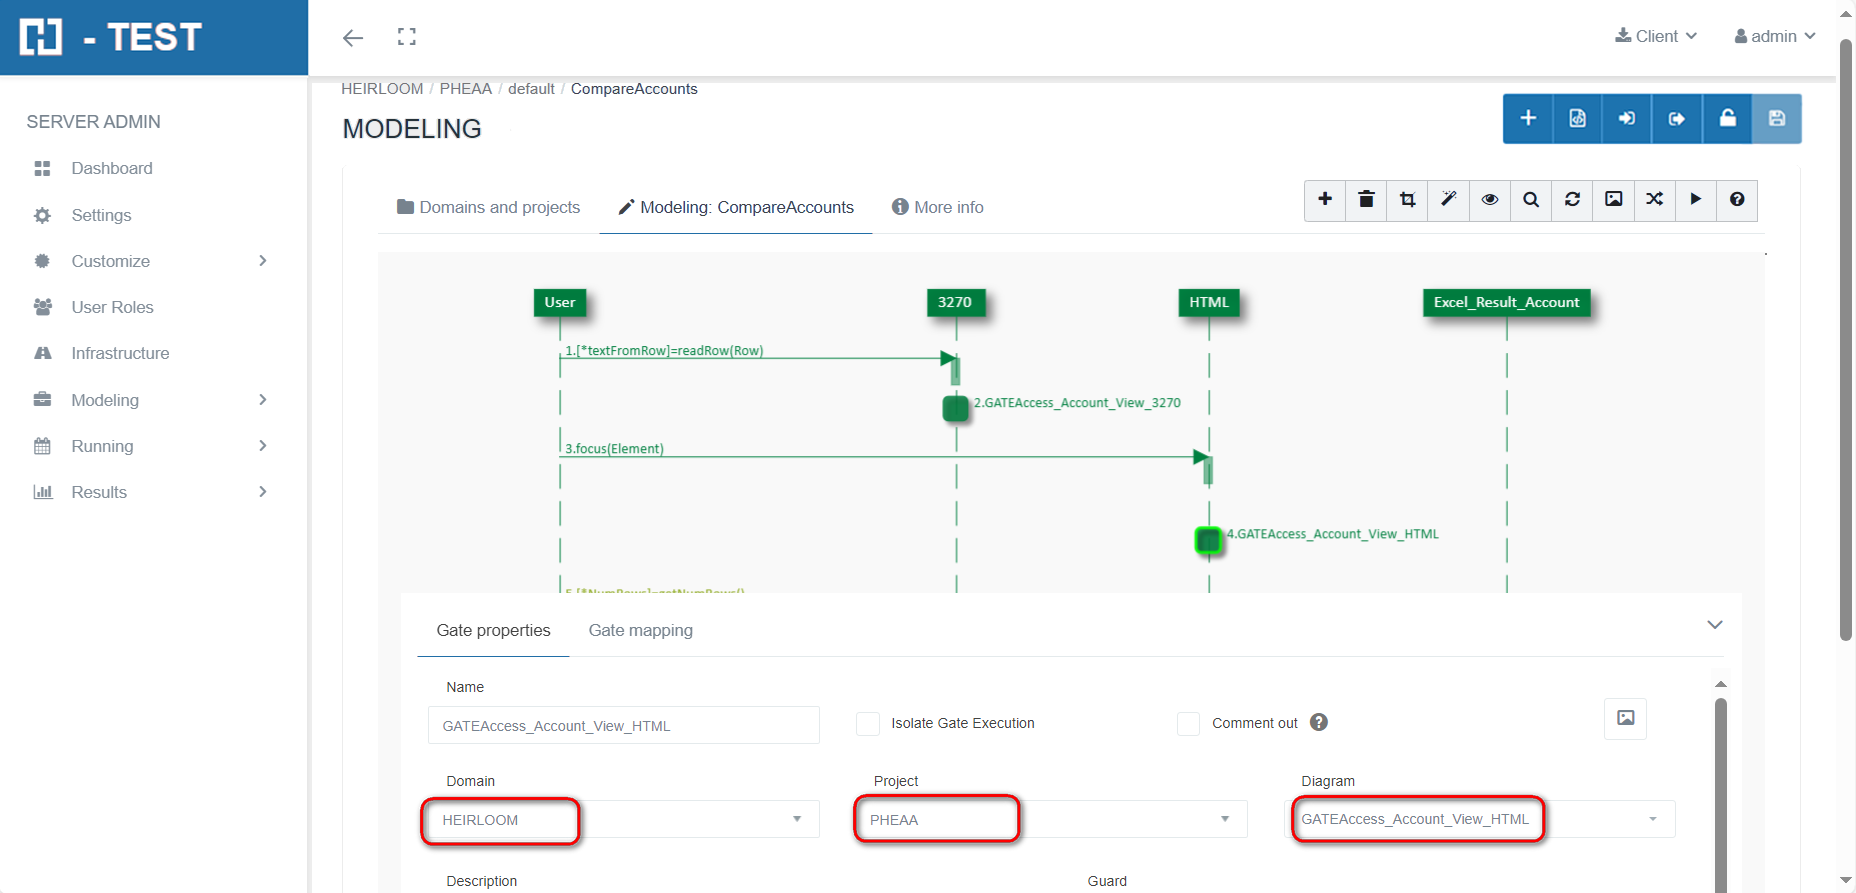
The selected diagram can be visualized by clicking on the icon of the image.
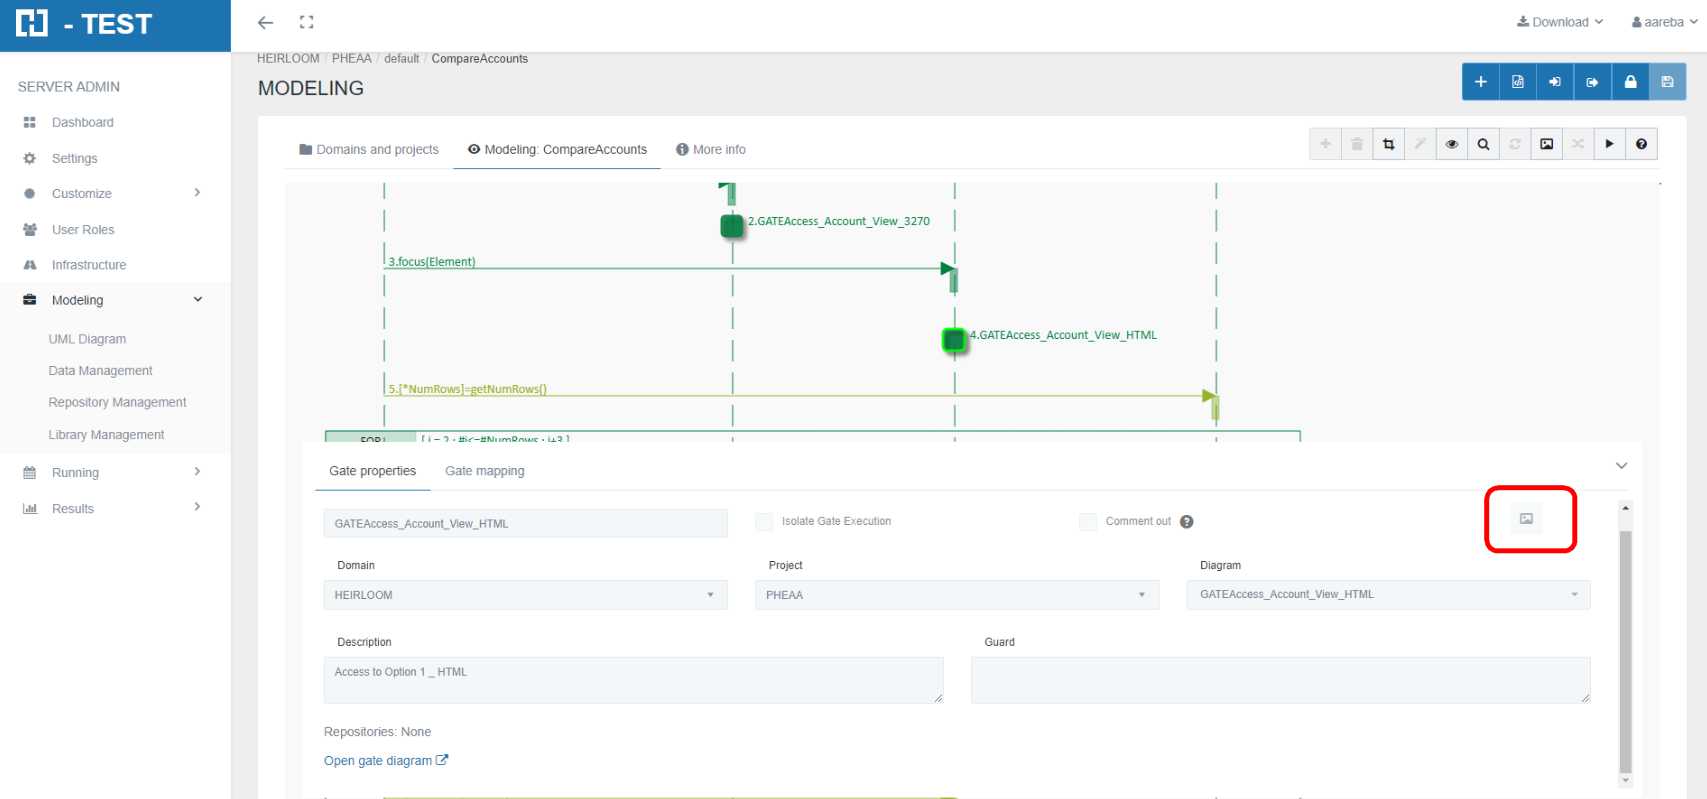
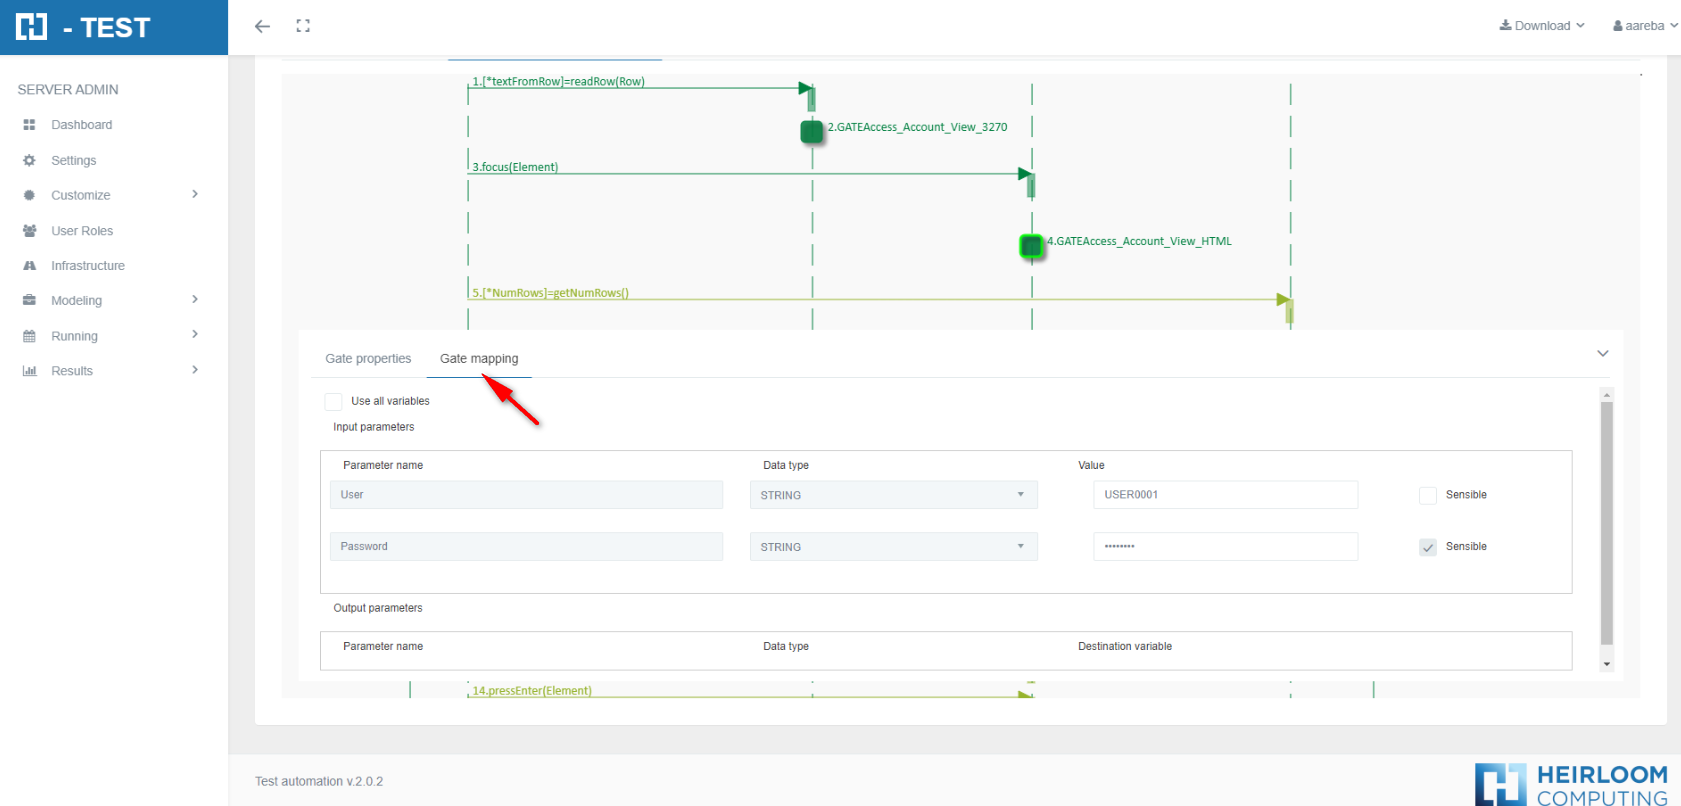
By clicking on the message map, it is displayed.
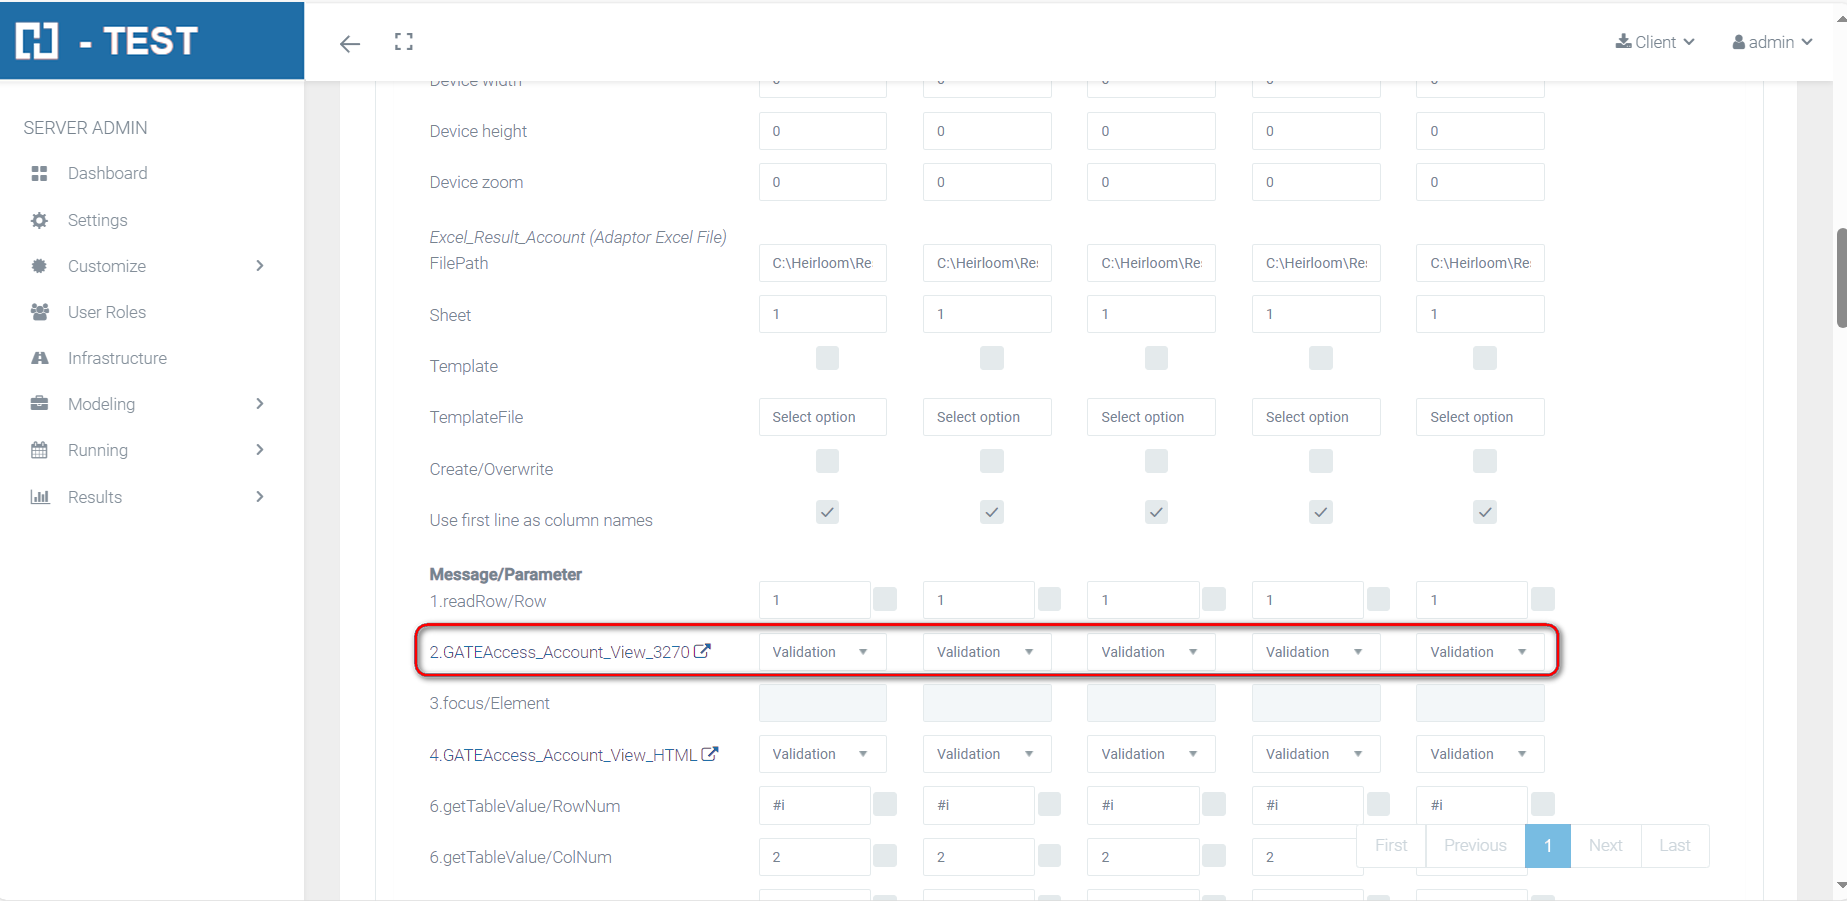
DATA MANAGEMENT: Allows to assign test case data to each Gate included in the diagrams.
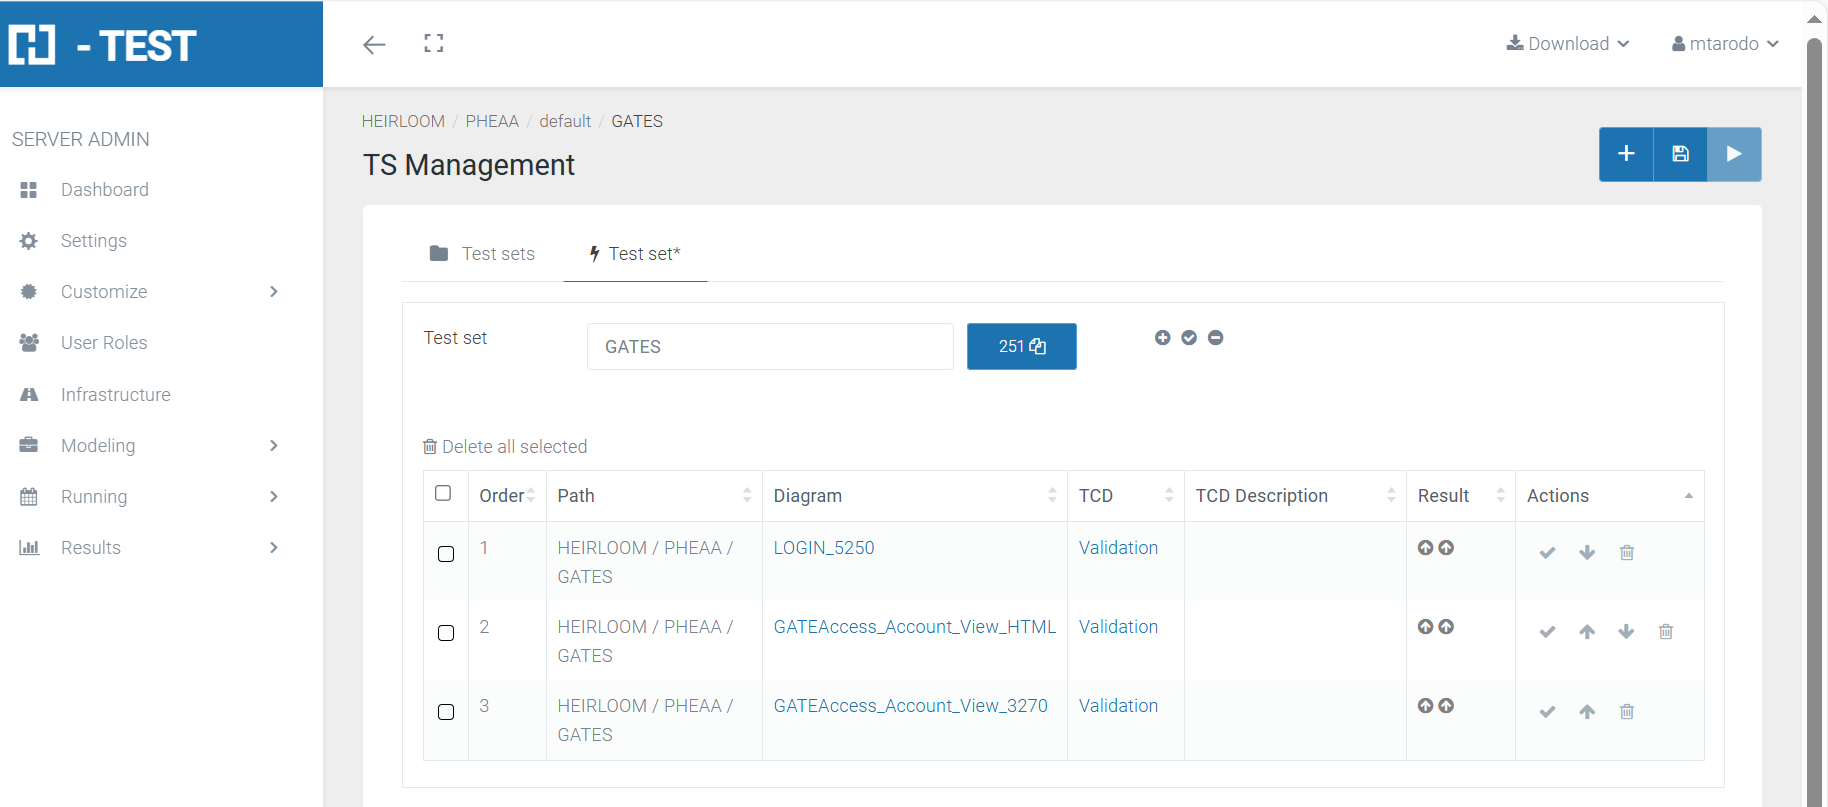
EXECUTION OF TEST SET WITH GATES: A Test Set containing Gates is created and executed.
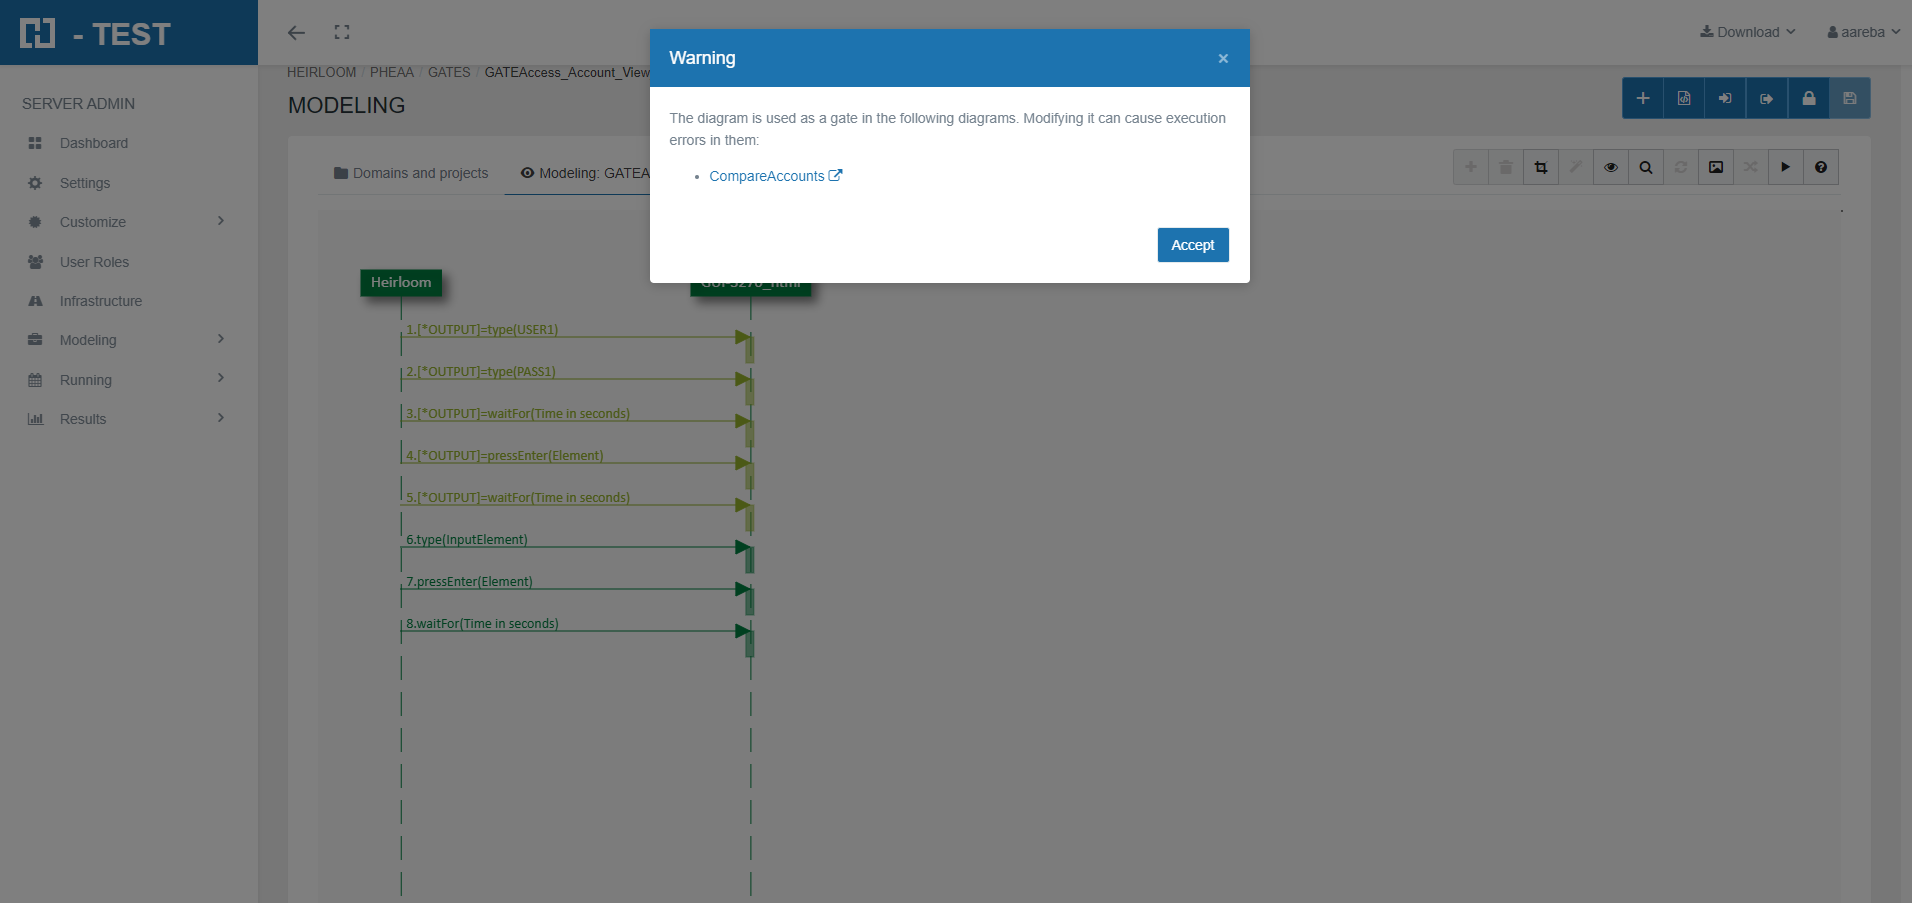
MODIFYING A GATE: if we want to open or modify a gate already created, the following warning will appear:
Combined Fragments
This option of the H-TEST tool allows the user to handle bifurcations and loops.
H-TEST allows the following types of combined fragment:
-
To handle bifurcations:
-
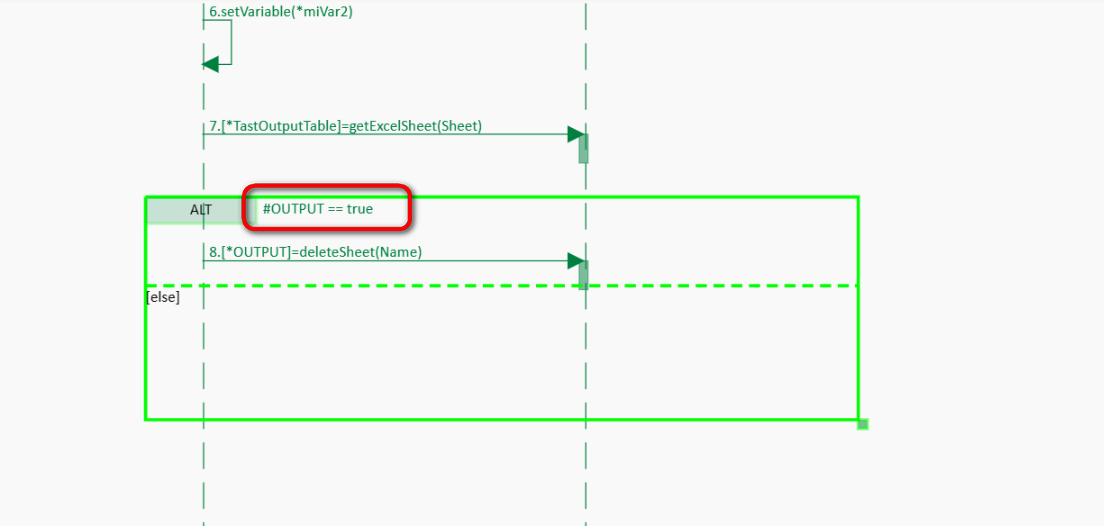
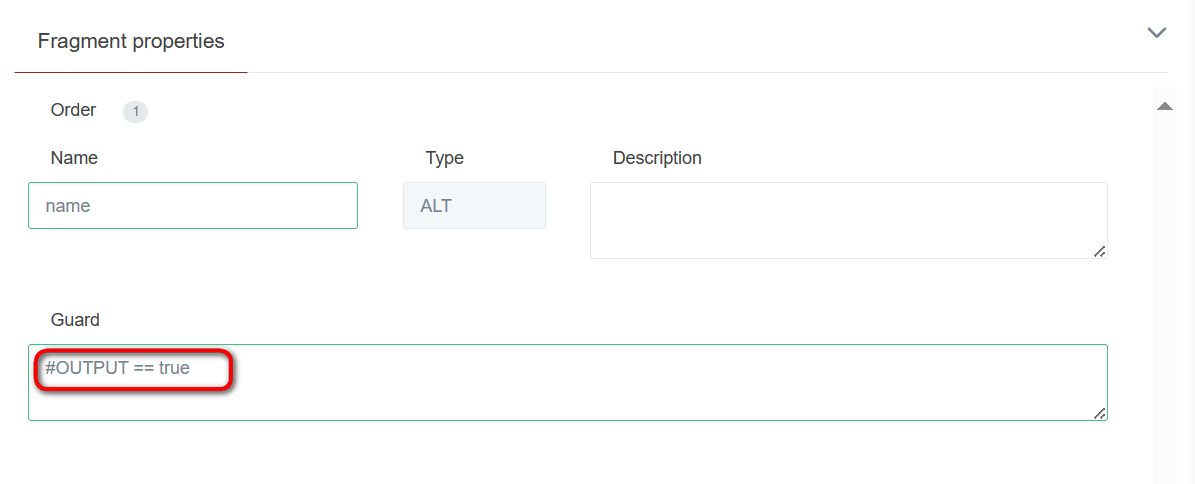
CF ALT: if the condition indicated in the Guard of the Combined Fragment is true, the steps of the first part of the ALT will be executed; otherwise, the steps executed will be those of the 'else' part:

-
-
To handle loops:
-
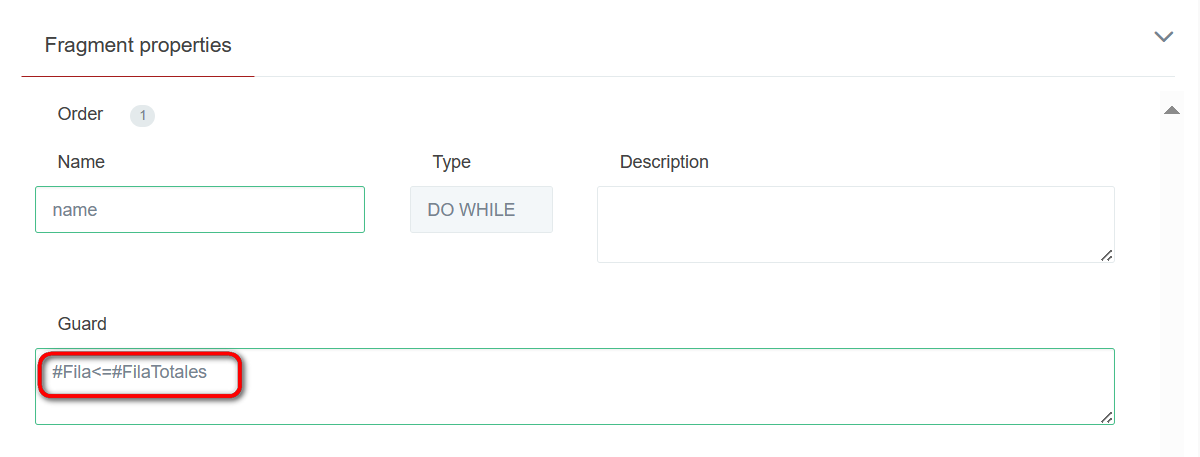
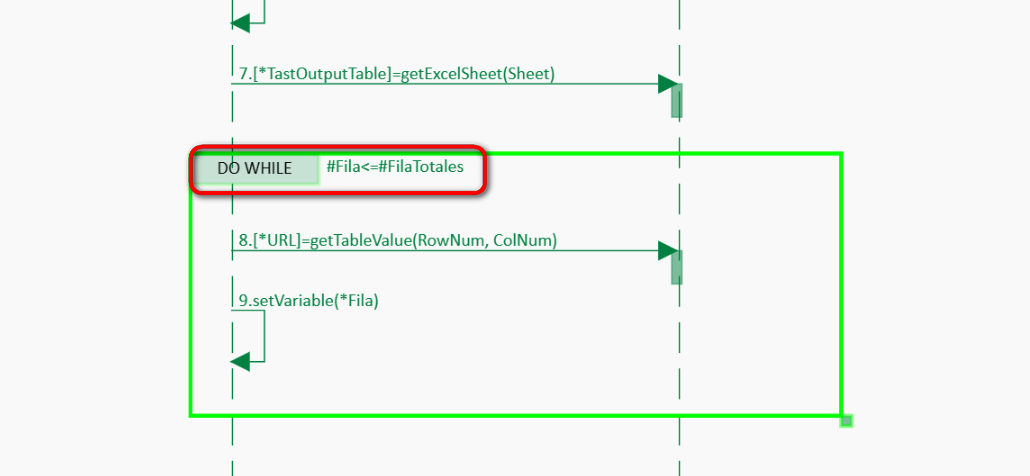
CF Loop do while: while the condition indicated in the Guard of the Combined Fragment is true, the steps of the Combined Fragment will be executed. The condition is check after the steps are executed, so do while loop guarantees the loop execution at least once:
-
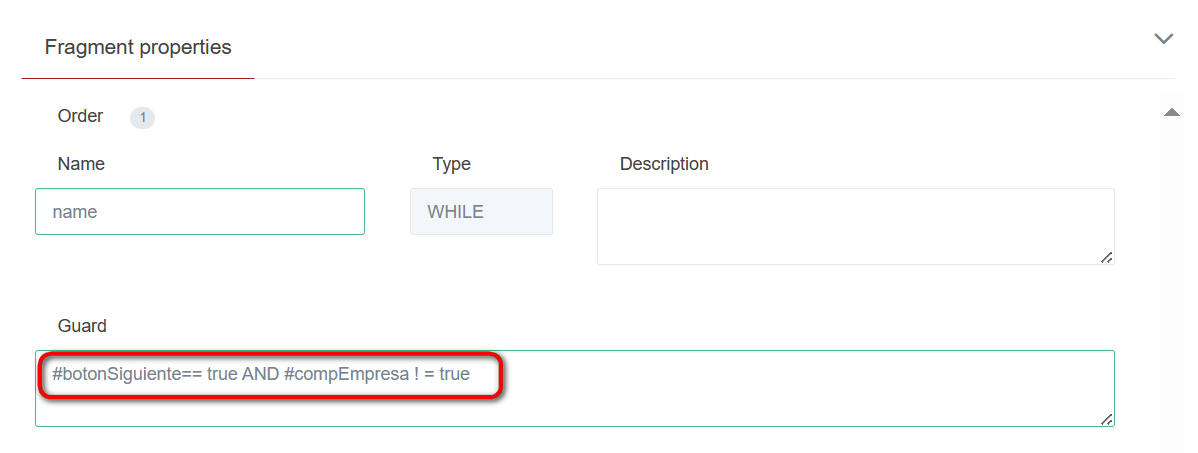
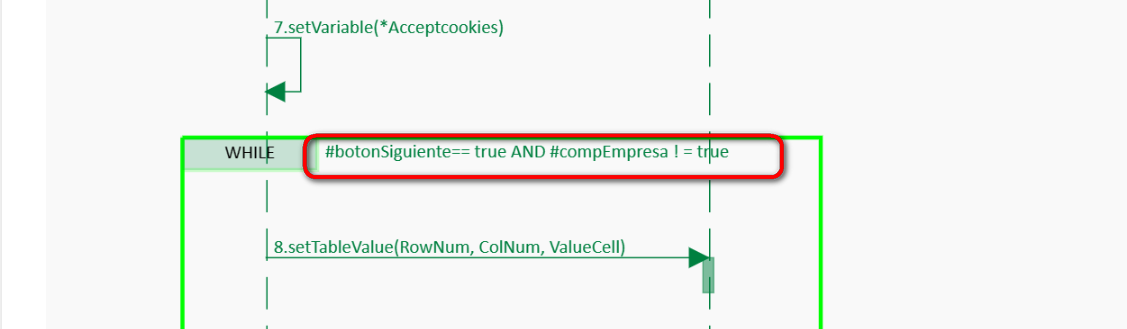
CF Loop while: this loop is similar to do while loop. The difference is when the exit condition of the cycle is evaluated. In the while loop this evaluation is done before entering the cycle, which means that the loop may not get executed:


-
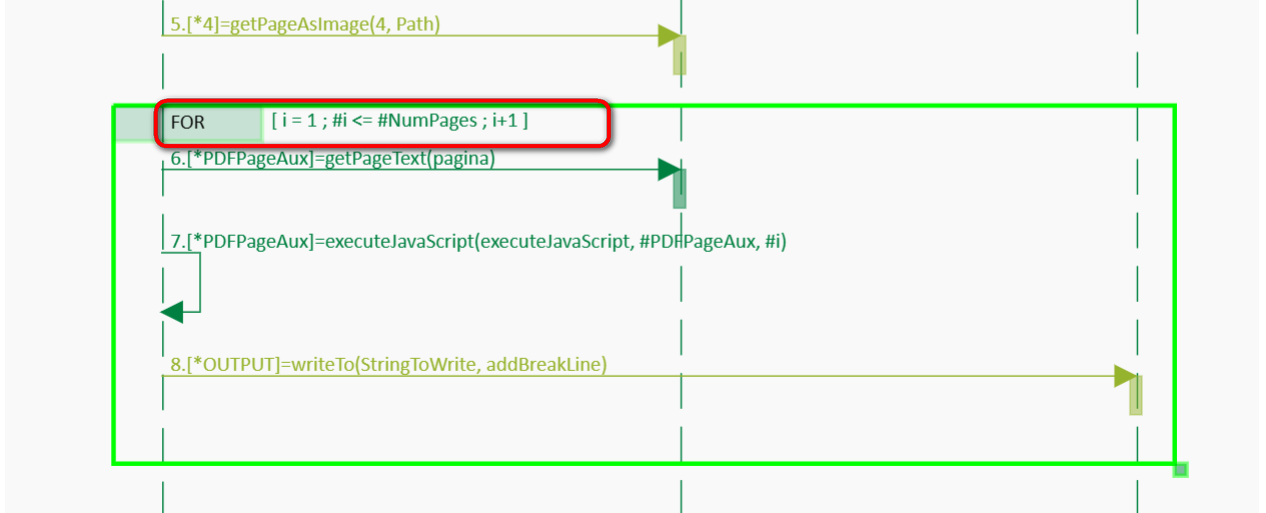
CF Loop for: All the steps included in this loop will be executed a number of times, according to the parameters indicated in the fragment properties tab:
Guard: this field indicates the condition that the specified variable must meet to execute the steps of the For loop. This variable will appear in the section 'Variable for iteration'.
Case start: contains the initial value that the variable will take for the iteration inside the loop.
Type increment: type of increment of the variable. It can be incremental (+) or decremental (-).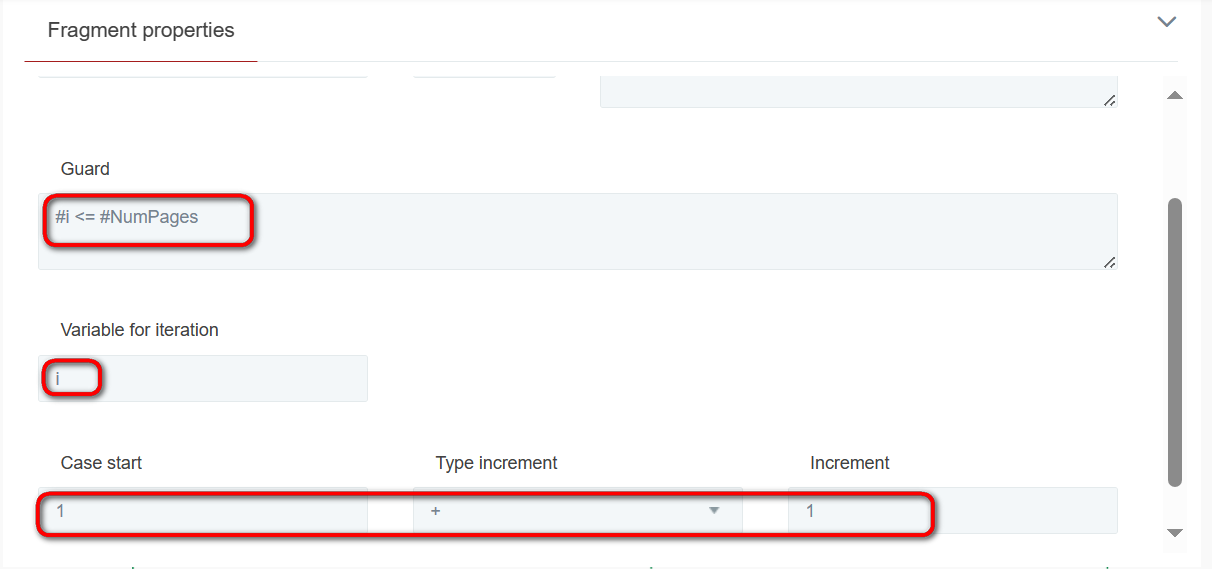
-
CF Loop for each: It enables to iterate one by one (from 1 … n) the selected row or column of a table introduced as variable. It makes possible to handle one by one the information selected in a Vertical or Horizontal way.
-


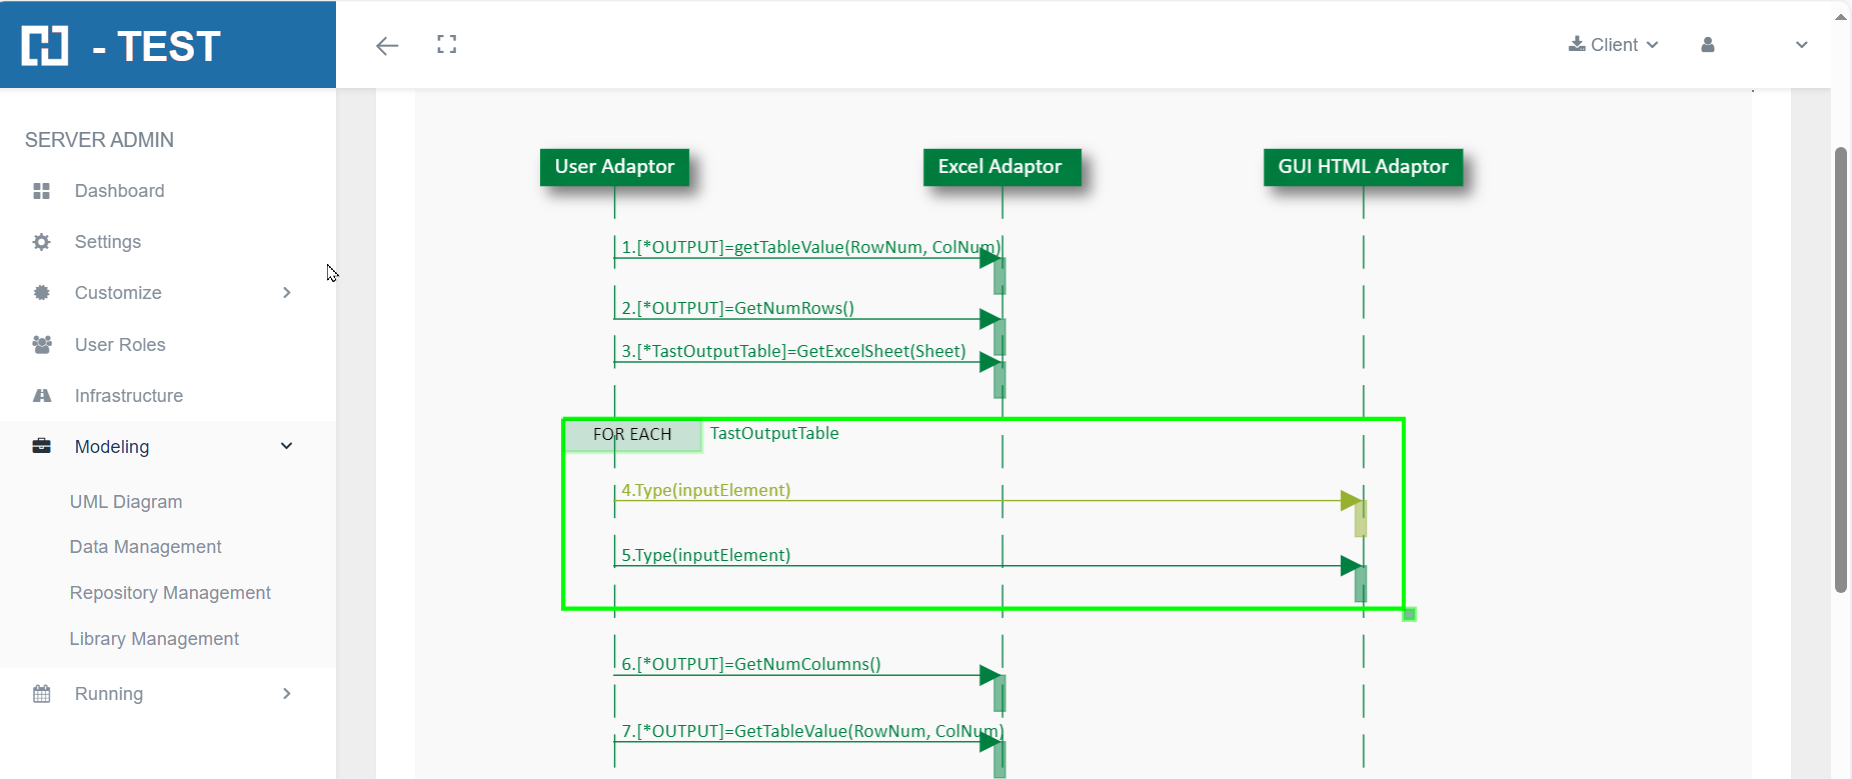
To get data from the object, use the name of the table, followed by the word “Row”, using the method getCellValue(n).
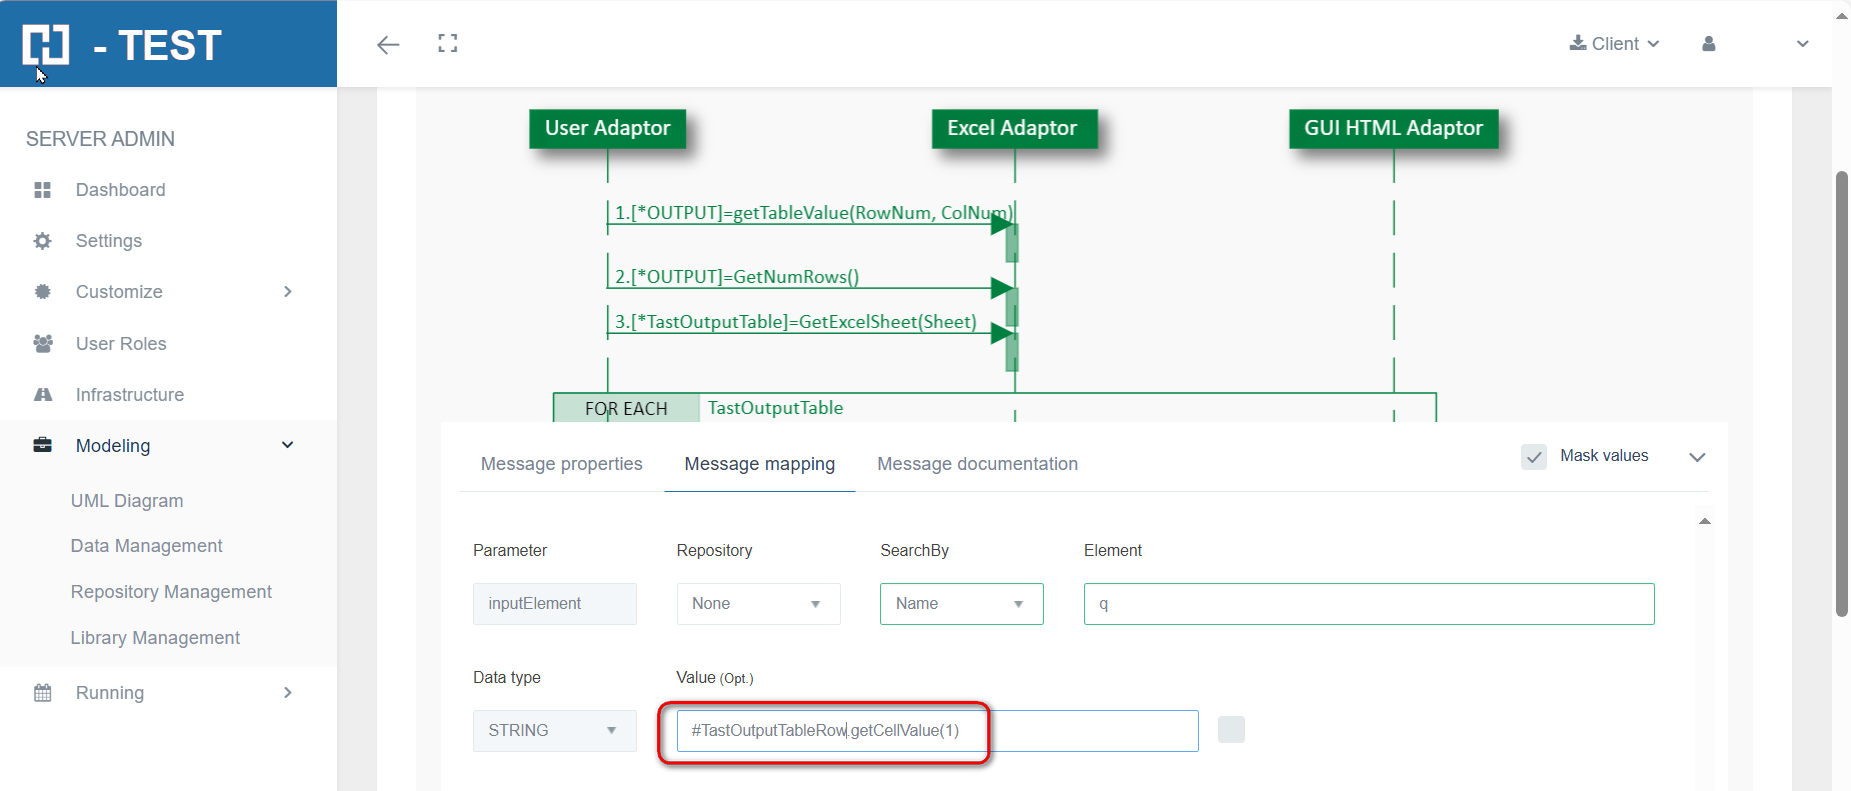
For the column, use the table name, followed by the word “Column”, using the method getCellValue(n).
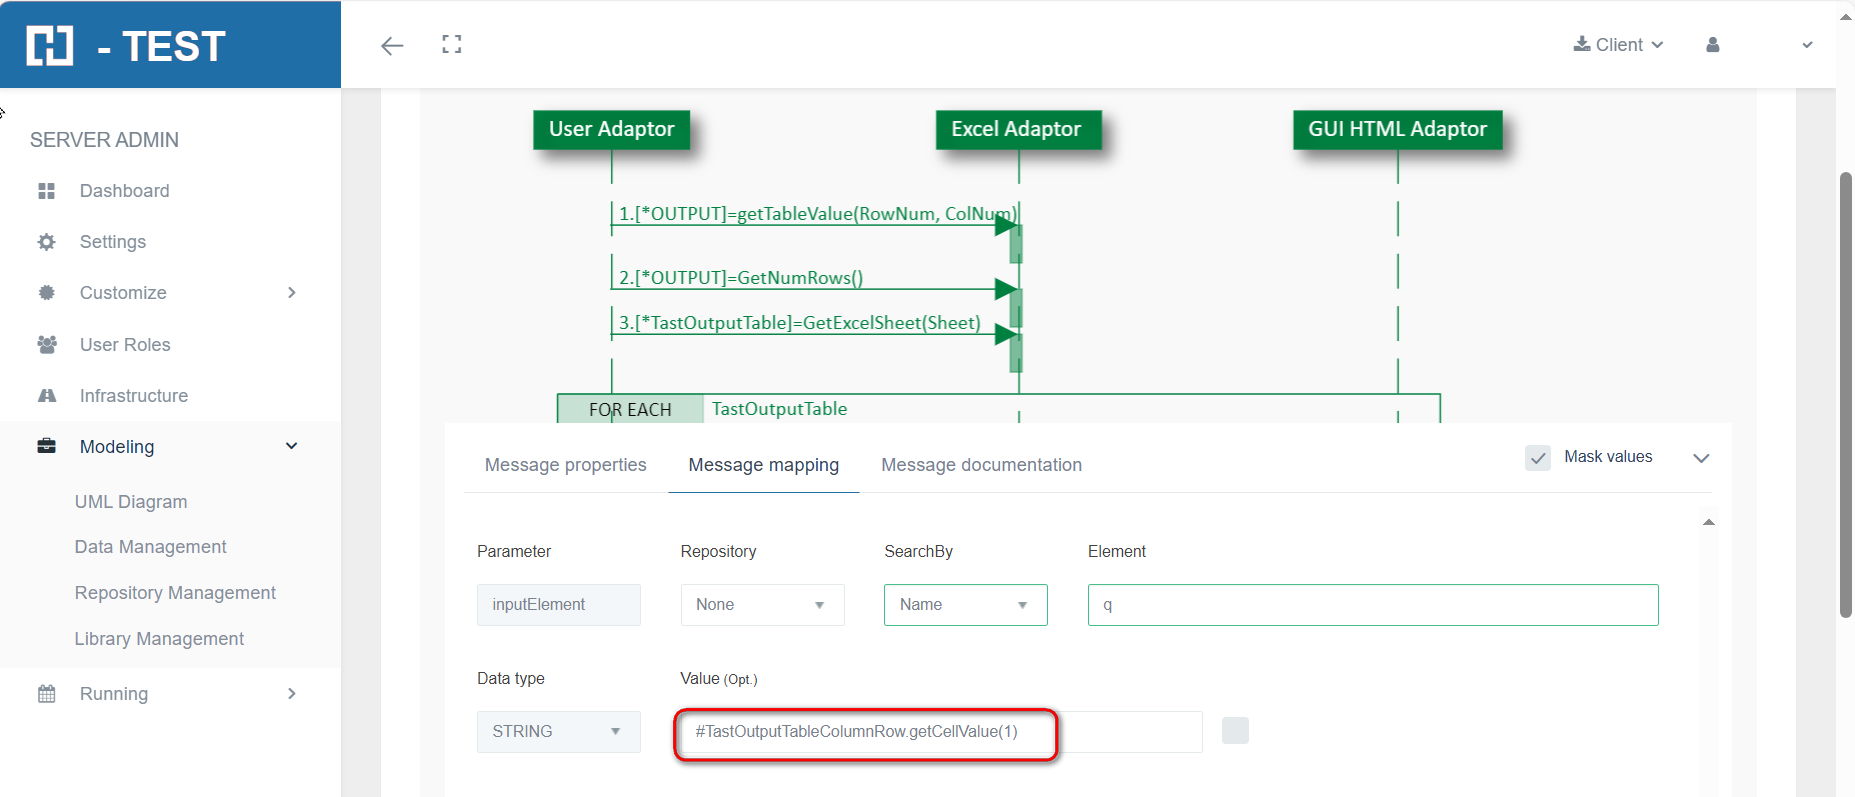
Where (n) is the position of the cell in the row or the position of the cell in the column.
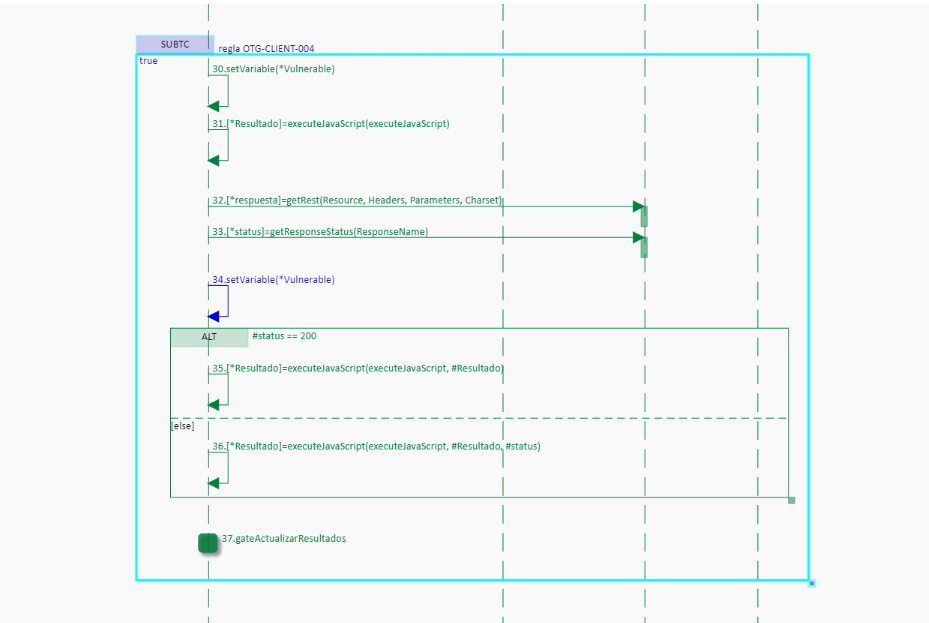
SubTestCases
Subtestcases are test cases that can be drawn inside a diagram. The reason to implement the subtestcases consists in having a visual option to create test cases in a diagram instead of only in Data Management. Also, to obtain a result (or/and log) with an isolated portion of a diagram (test case) apart of the main result or log.
How to use it in a diagram
To use a subtestcase in a diagram, go to the toolbar, click on the ”+” icon and then select subtestcase. You can also use “ALT + S” as a shortcut to draw it. To place it on the canvas you will have to click where you want to place it.
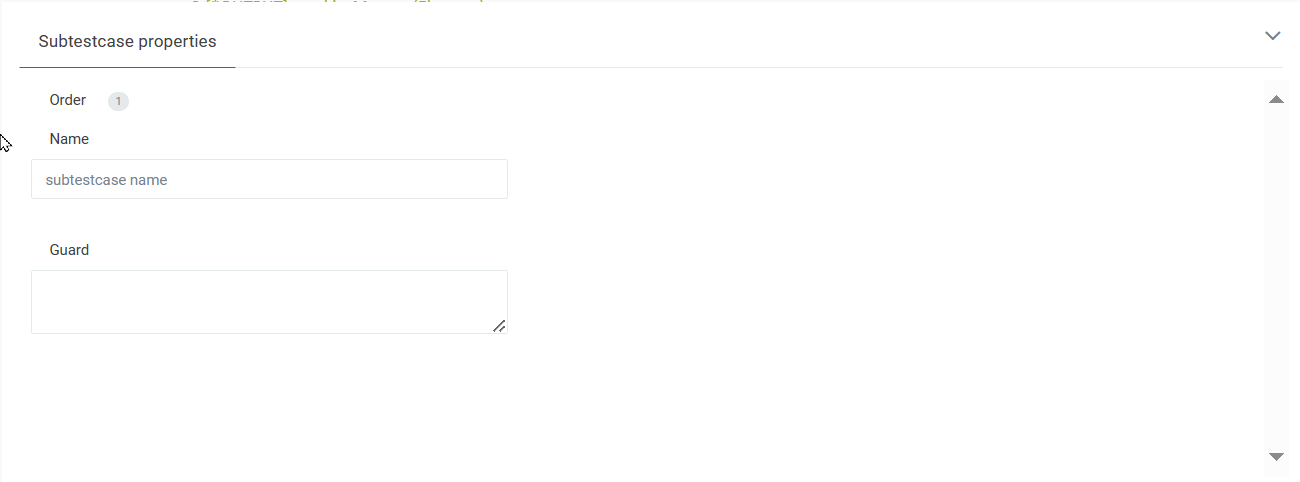
To open the subtestcases properties, double click in the subtestcase and it will appear, here you can change the name of the subtestcase (up to 100 characters) and add/edit a guard. Also you can set a name with a variable like: “name of the subtestcase” + #Variable It also works as: ‘name of the subtestcase‘ + #Variable.
SubTestCases specs
There are some things to keep in mind using subtestcases:
-
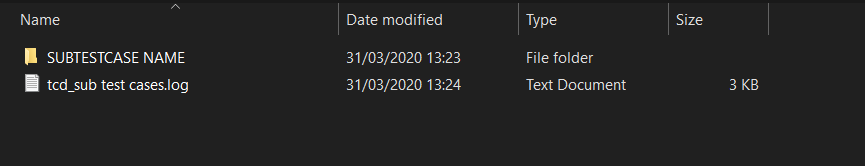
All the messages inside the subtestcase will work as usual in the diagram but will generate a different result and log. So, in the end, we will have one global and another with the content of the subtestcase. If you want to retrieve the logs from the client it will look like the following image, inside the folder is the subtestcase log. It will generate a folder for every subtestcase in the diagram.
-
You cannot nest subtestcases, it will only register one of the subtestcases nested it must be avoided.
-
Inside a subtestcase can be placed steps and fragments, those fragments can be nested.
-
Inside a fragment can be placed a subtestcase and that subtestcase can be like the point 3.
-
The Subtestcases can be deleted, as well as copied and pasted.
-
Various subtestcases can be placed in the same diagram (but not nested).
SubTestCases in Data Management
In Data Management once you have a diagram with a subtestcase (or various) the SubTestCase will appear as a blue rectangle.
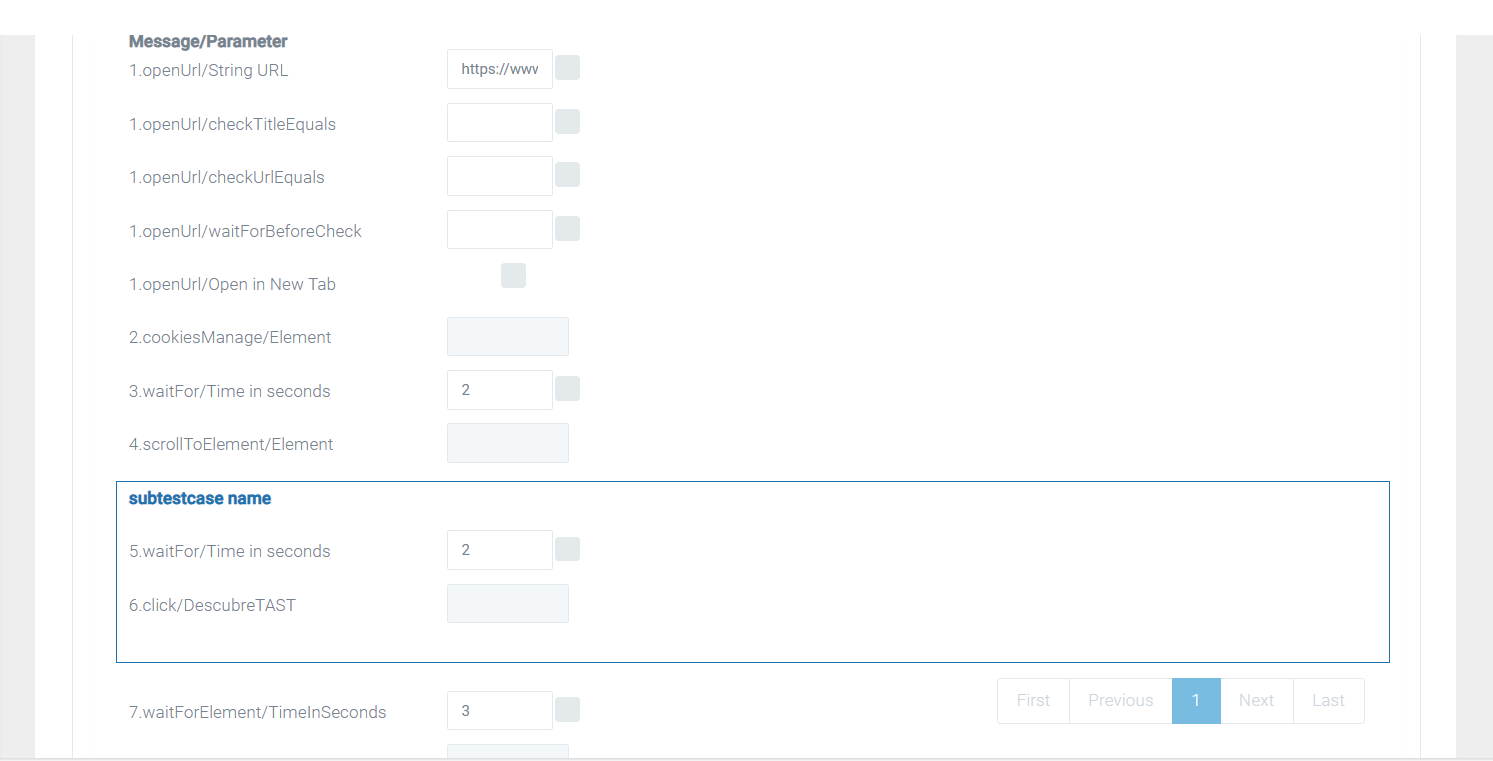
Data Management can be used as usually with the addition of subtestcases appearing there.
SubTestCases in Results Page
In results page a new functionality has been added, with the symbol of “+” you can click to deploy a new table with all the subtestcases an execution has. For example, in the following image:
![]()
We can see the result as always. But with the new addition:

You can now see the subtestcases results. Here you can download the evidences and the result document of the subtestcase.
In the result document: This is not a example subtescase.
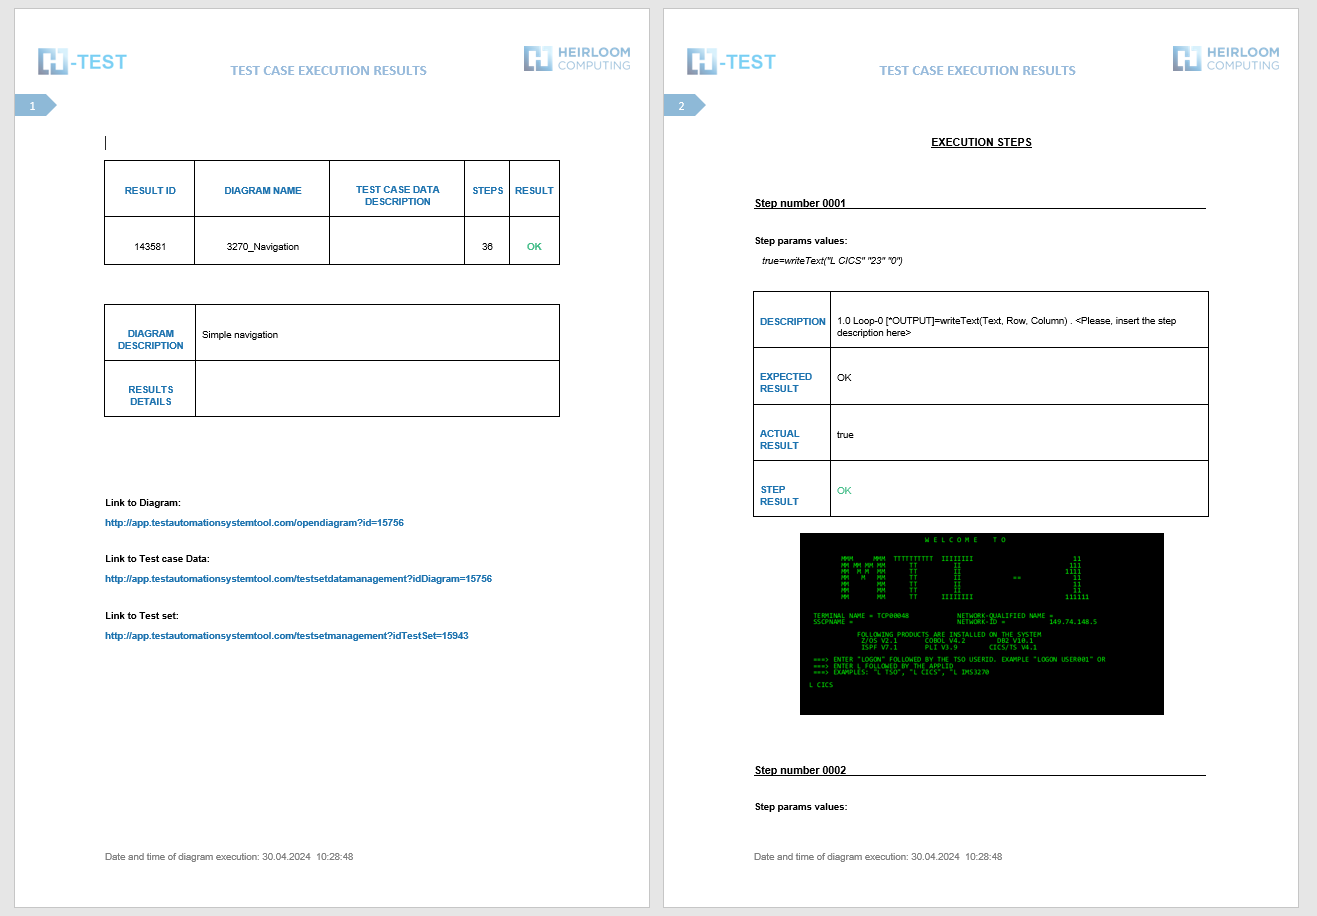
In test case data description, you can see the name of the subtestcase, in case that the test case data had a description it will show you “testcasedatadescription_subtestcasename”.
SubTestCase in ALM
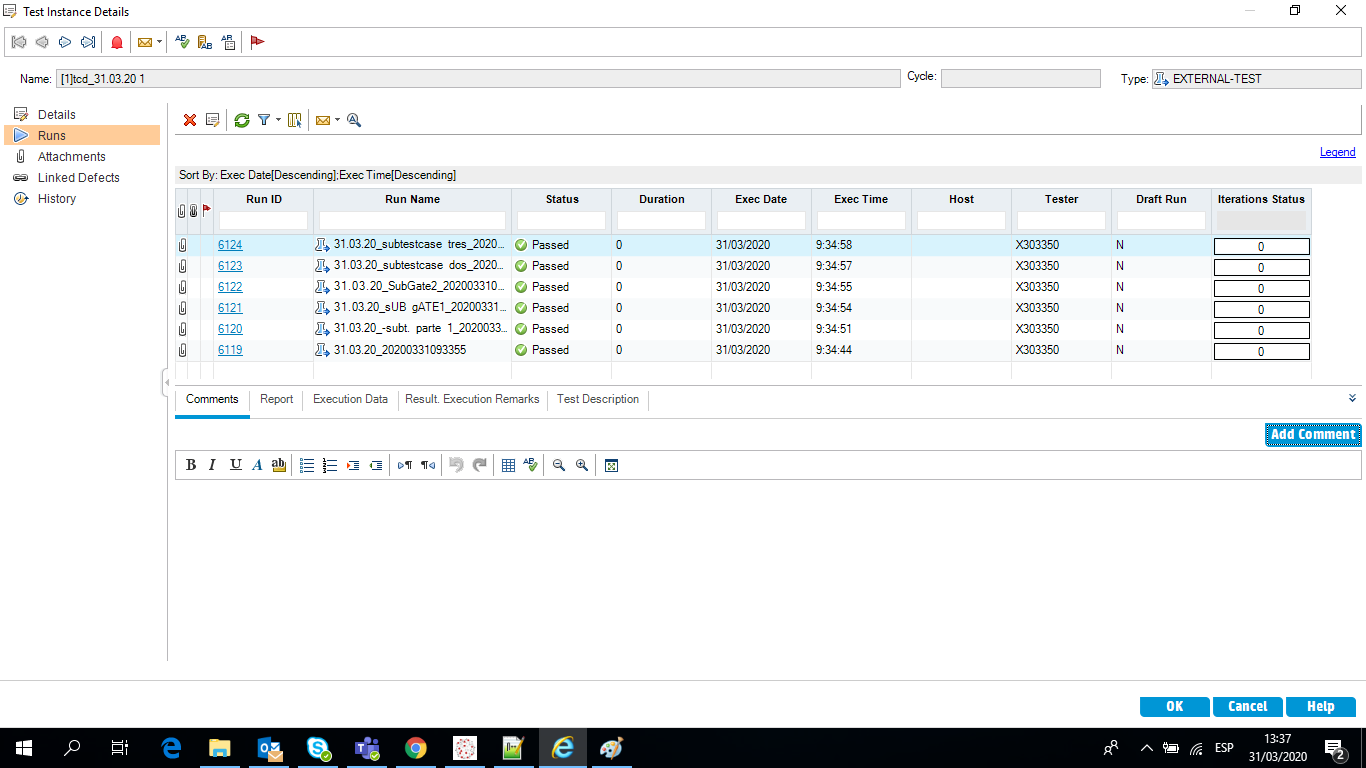
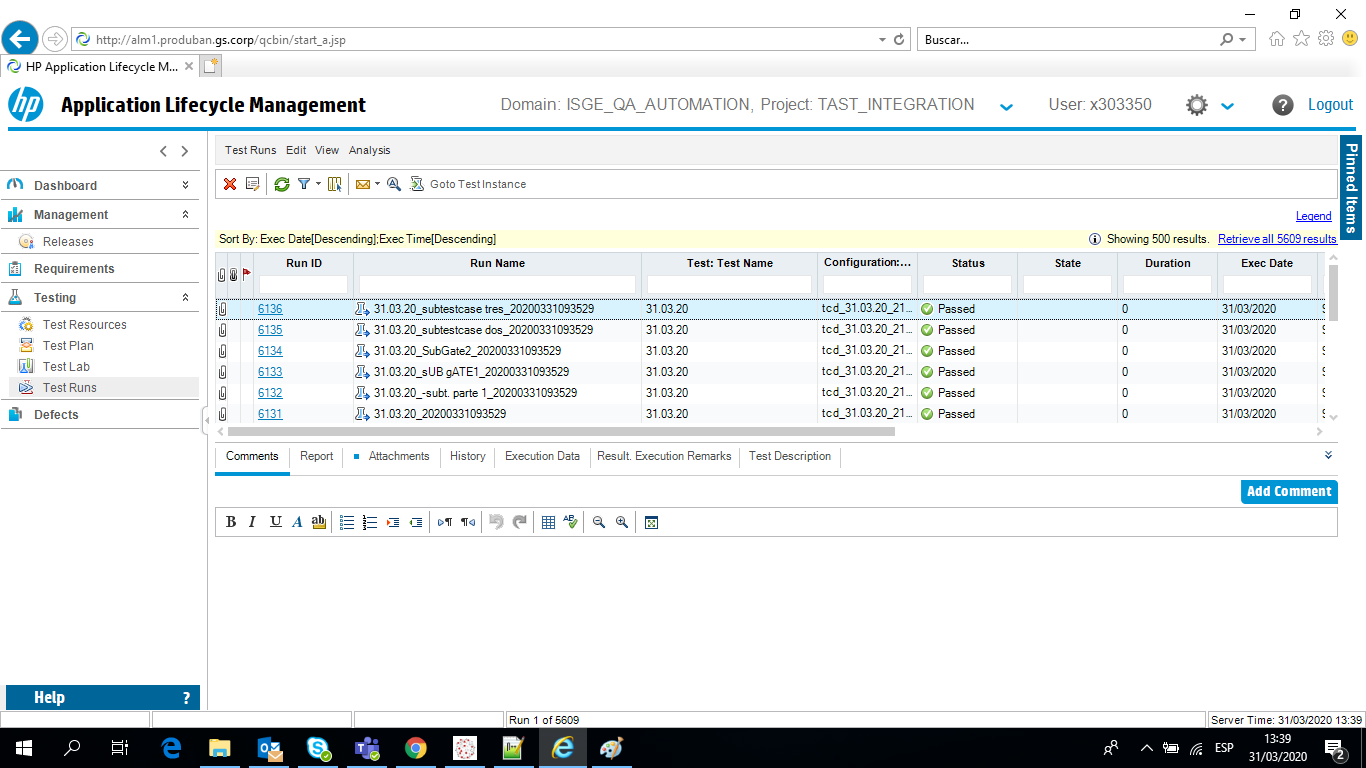
In ALM it will show the full evidences of the execution, and all the subtestcases in the execution separatedly (also if you have gates with subtestcases those will be registered aswell).
Delete a message
When you want to remove a message from a diagram, H-TEST offers several alternatives:
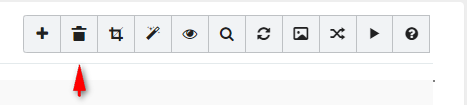
The first one allows us to delete the selected object(s) from the diagram by clicking on the trash can icon in the toolbar.
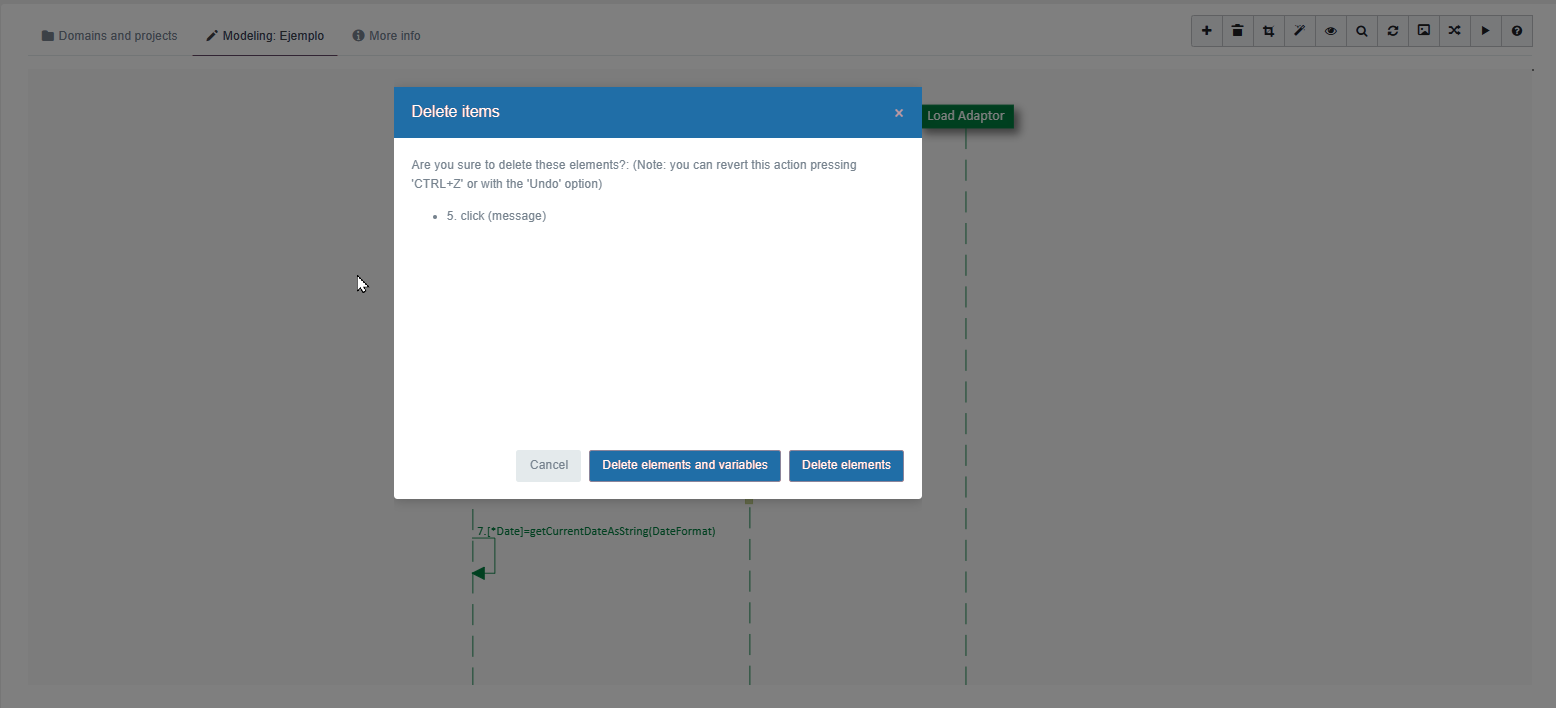
The following window appears with 2 possible options for deleting (Delete elements and variables, Delete elements) and a Cancel/back option.
-
Cancel: the message is not deleted. The delete confirmation window is closed.
-
Delete message and variables: the message and the references of the variables declared by that message are deleted. The delete confirmation window is closed.
-
Delete only the message: only the message is deleted, remaining the references of the variables declared by that message. The delete confirmation window is closed.
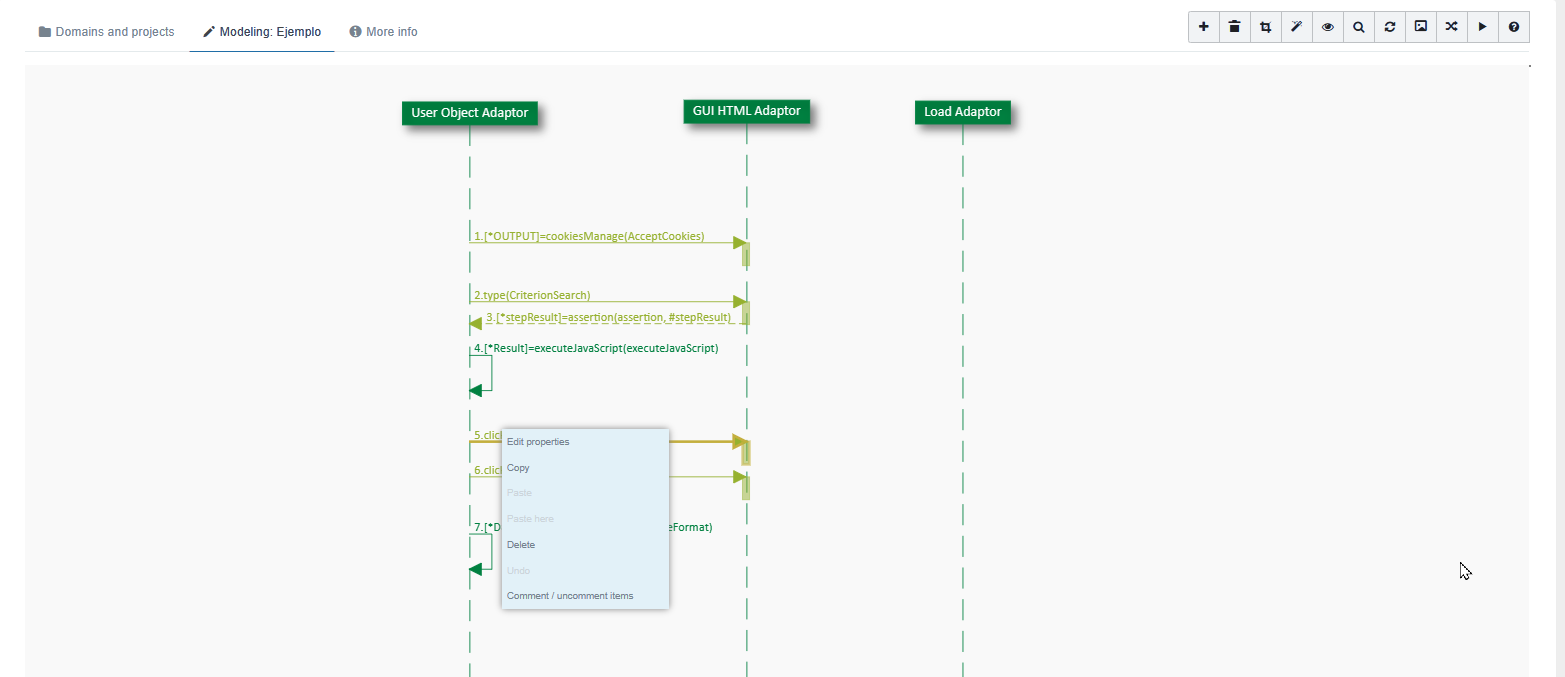
A second one would be to click with the right mouse button on any object in the canvas, a dynamic contextual menu appears, which presents a series of options depending on the type of object. If the “Delete” option is checked, the same previous screen appears and you will confirm whether you want to “Delete elements and variables”, “Delete elements” or “Cancel/go back”.
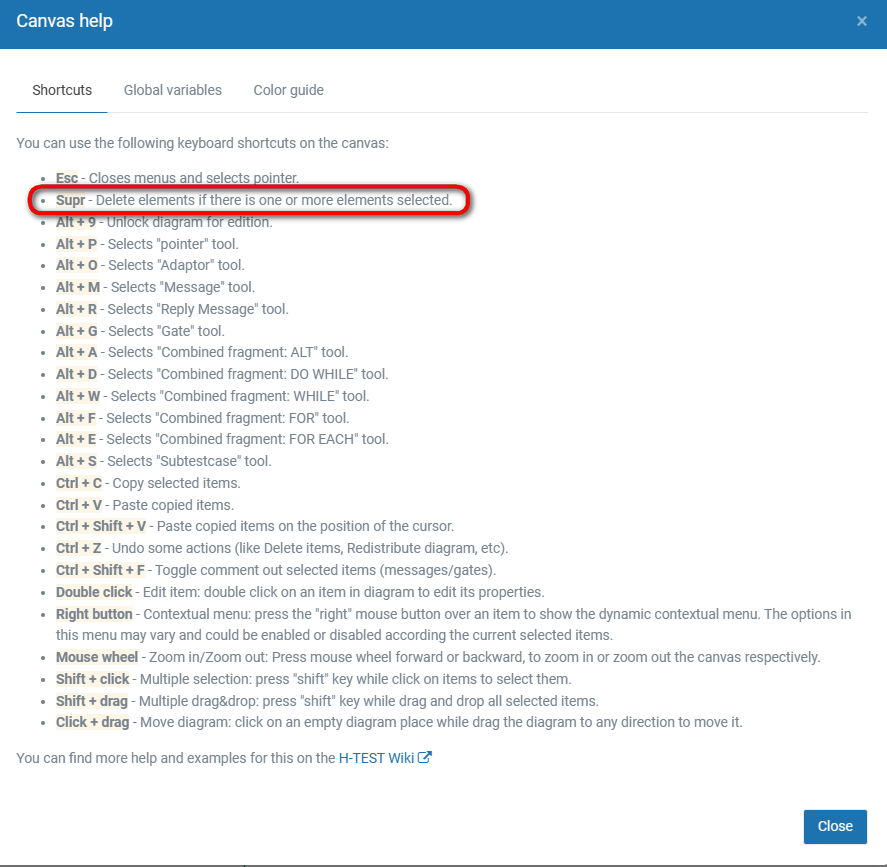
And finally, we can delete an element (this option only allows us to “Delete elements” or “Cancel/go back”), in a faster way (shortcut), using the keyboard. In this case the Delete key. This information about the keyboard shortcuts in the canvas will be displayed by clicking on the ”?” icon in the toolbar.

And then all the necessary help will be displayed:
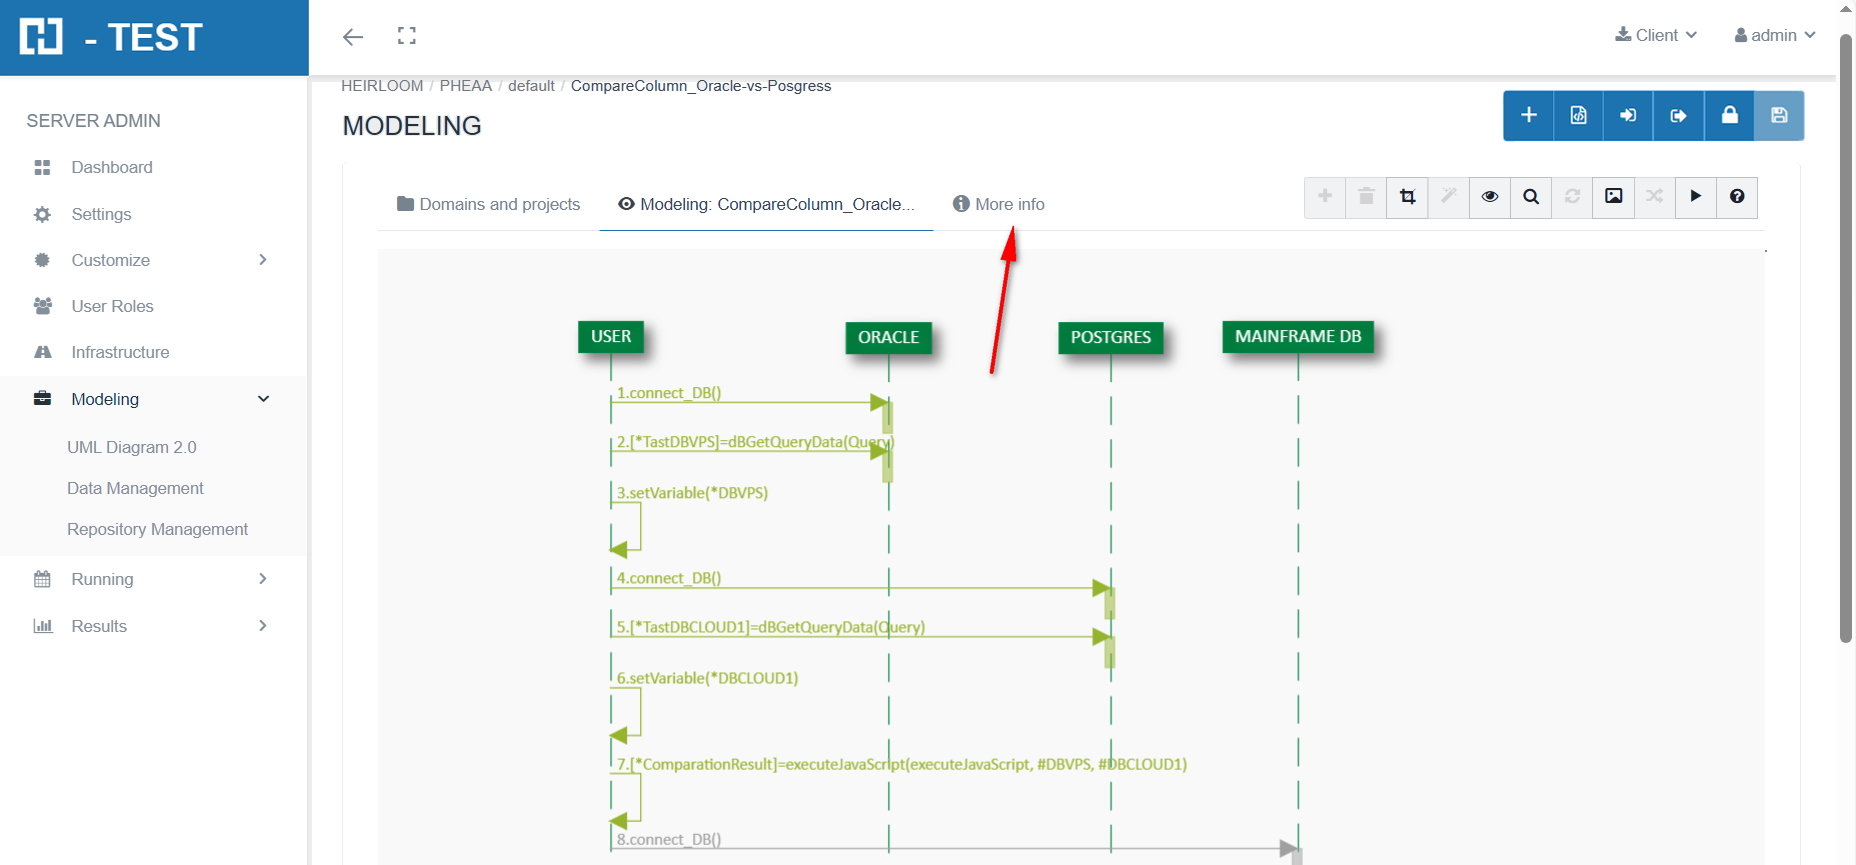
Information about the management of UML diagrams
Below, the screen to manage the UML diagrams :
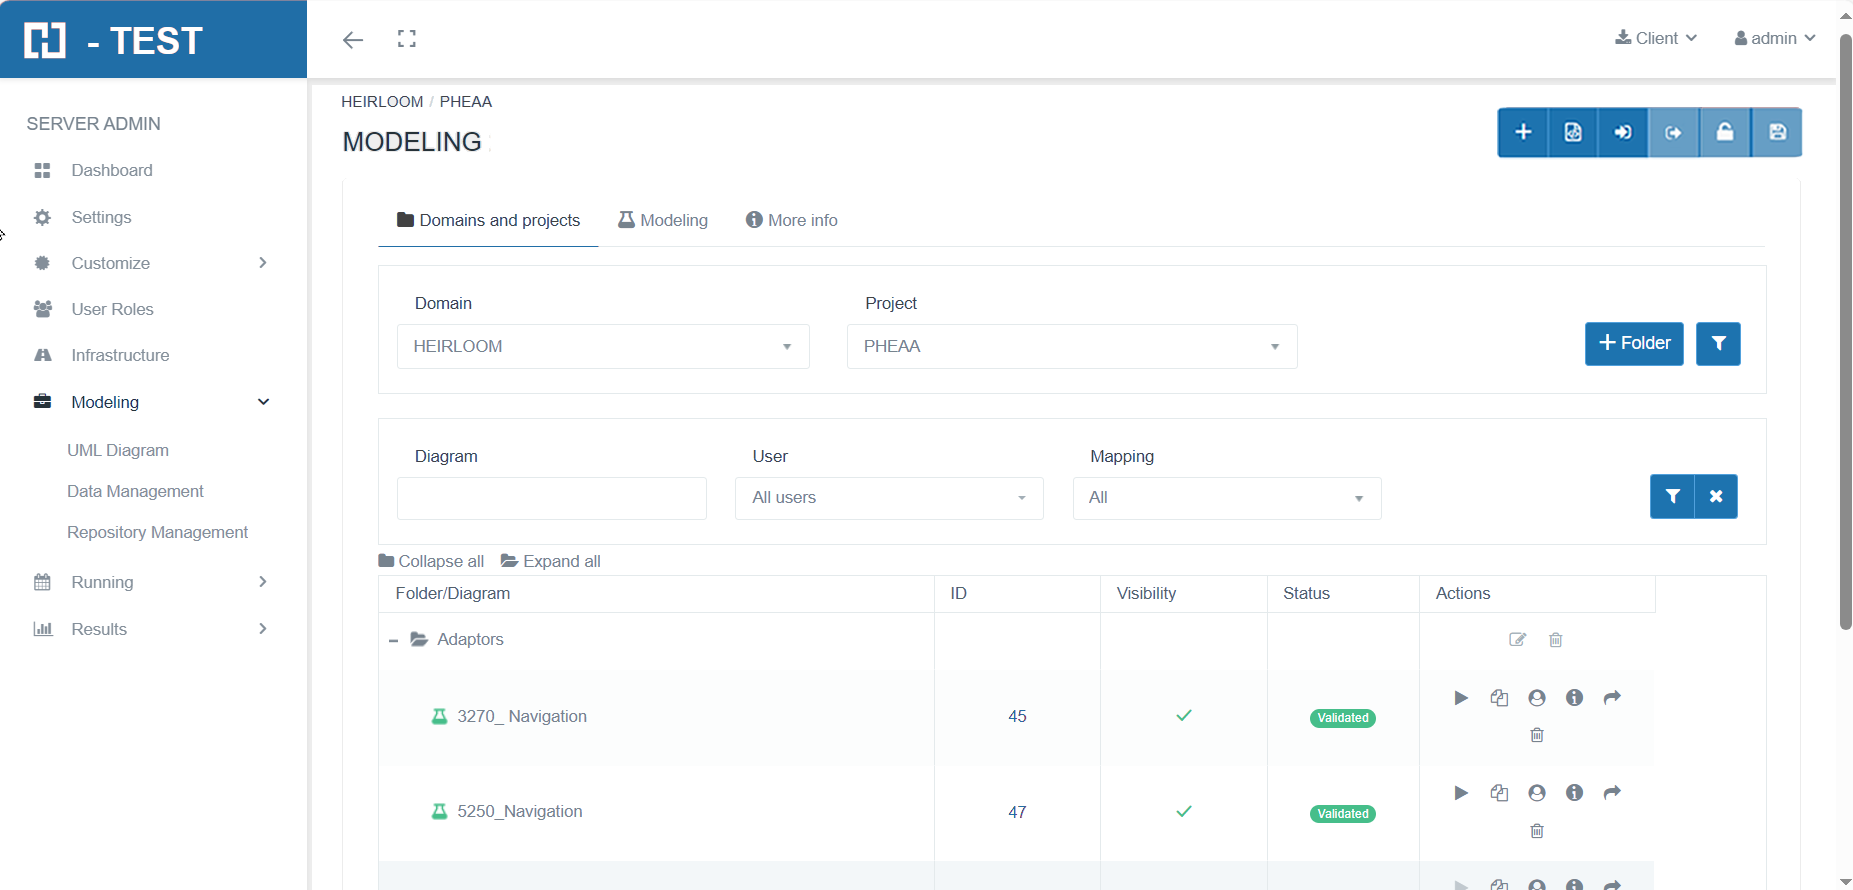
We can see the diagram information by clicking on the 'More info' icon.
You can page the diagrams using the page numbers at the bottom of the screen.
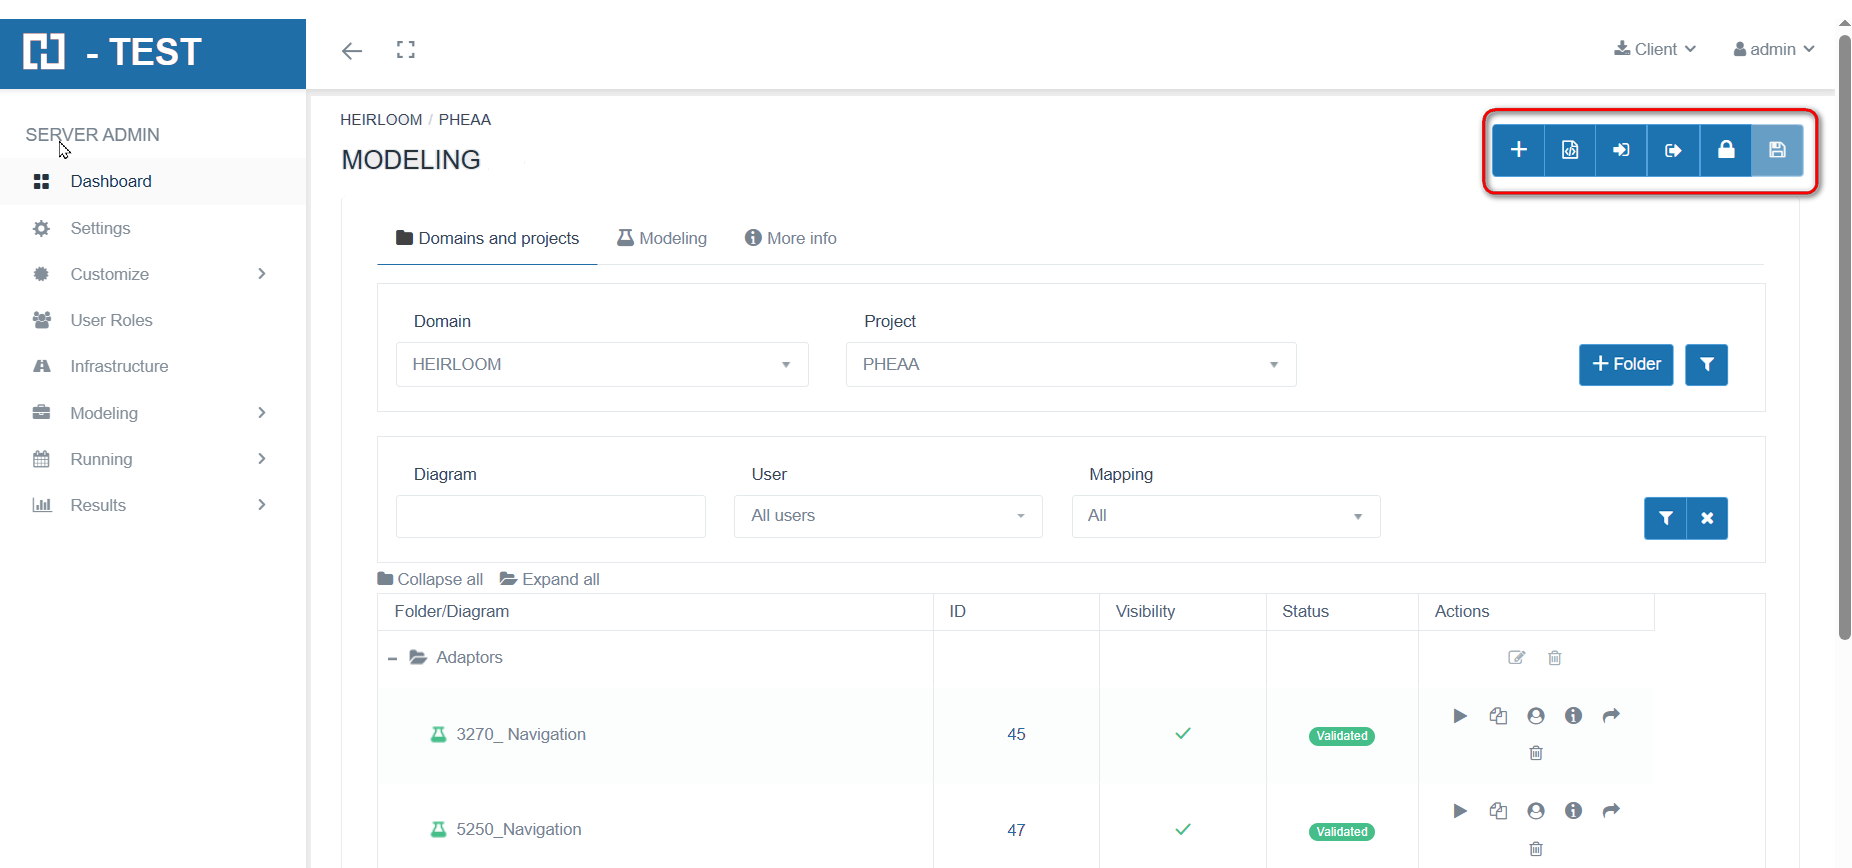
This screen allows:
- Create a new diagram (New diagram option).
- Save the information of the active diagram on screen (diskette icon).
- Delete a diagram, using the bin icon.
- Create a new folder (Folder option).
- Select diagrams using filter and mapping, clicking the filter icon.
- Deactivate-the-filters-used, using the cross icon.
- Edit a diagram for its update, double click.
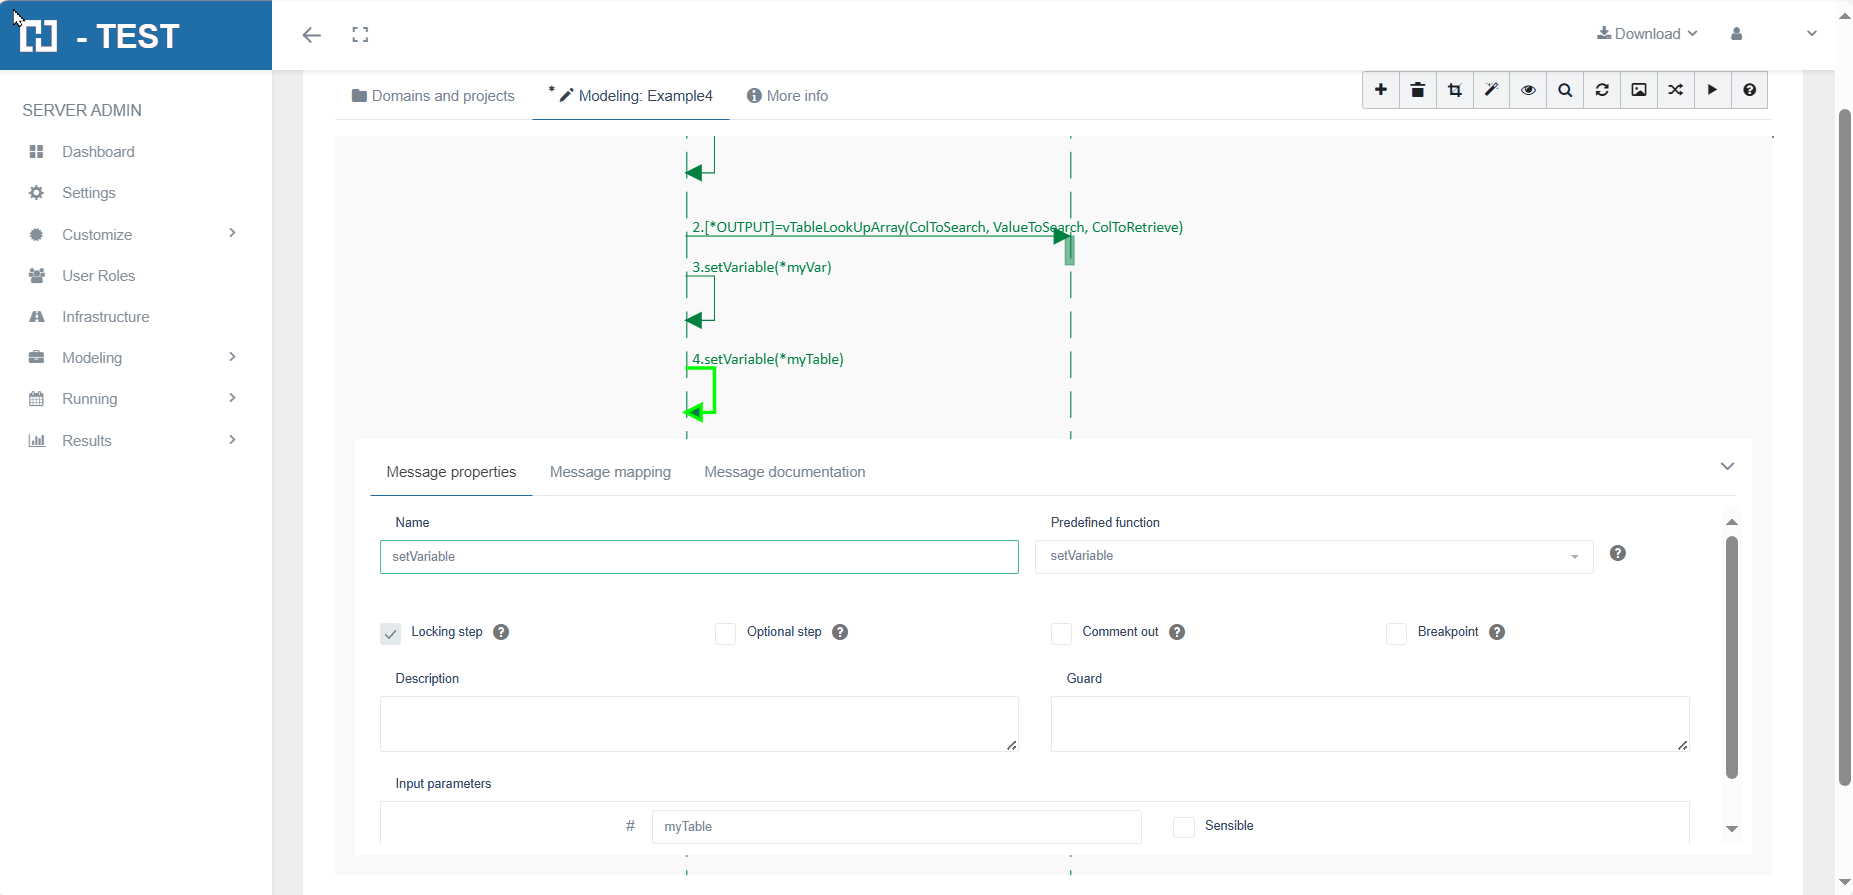
Message Properties Tab
In the mapping Tab you set the information at the message level:
-
Name: Message Name.
-
Description: Message Desscription.
-
Predefined Function: Selected Prefdefined Function (form a combo list).
-
Input Parameters: Depending of having or not parameters the selected PF.
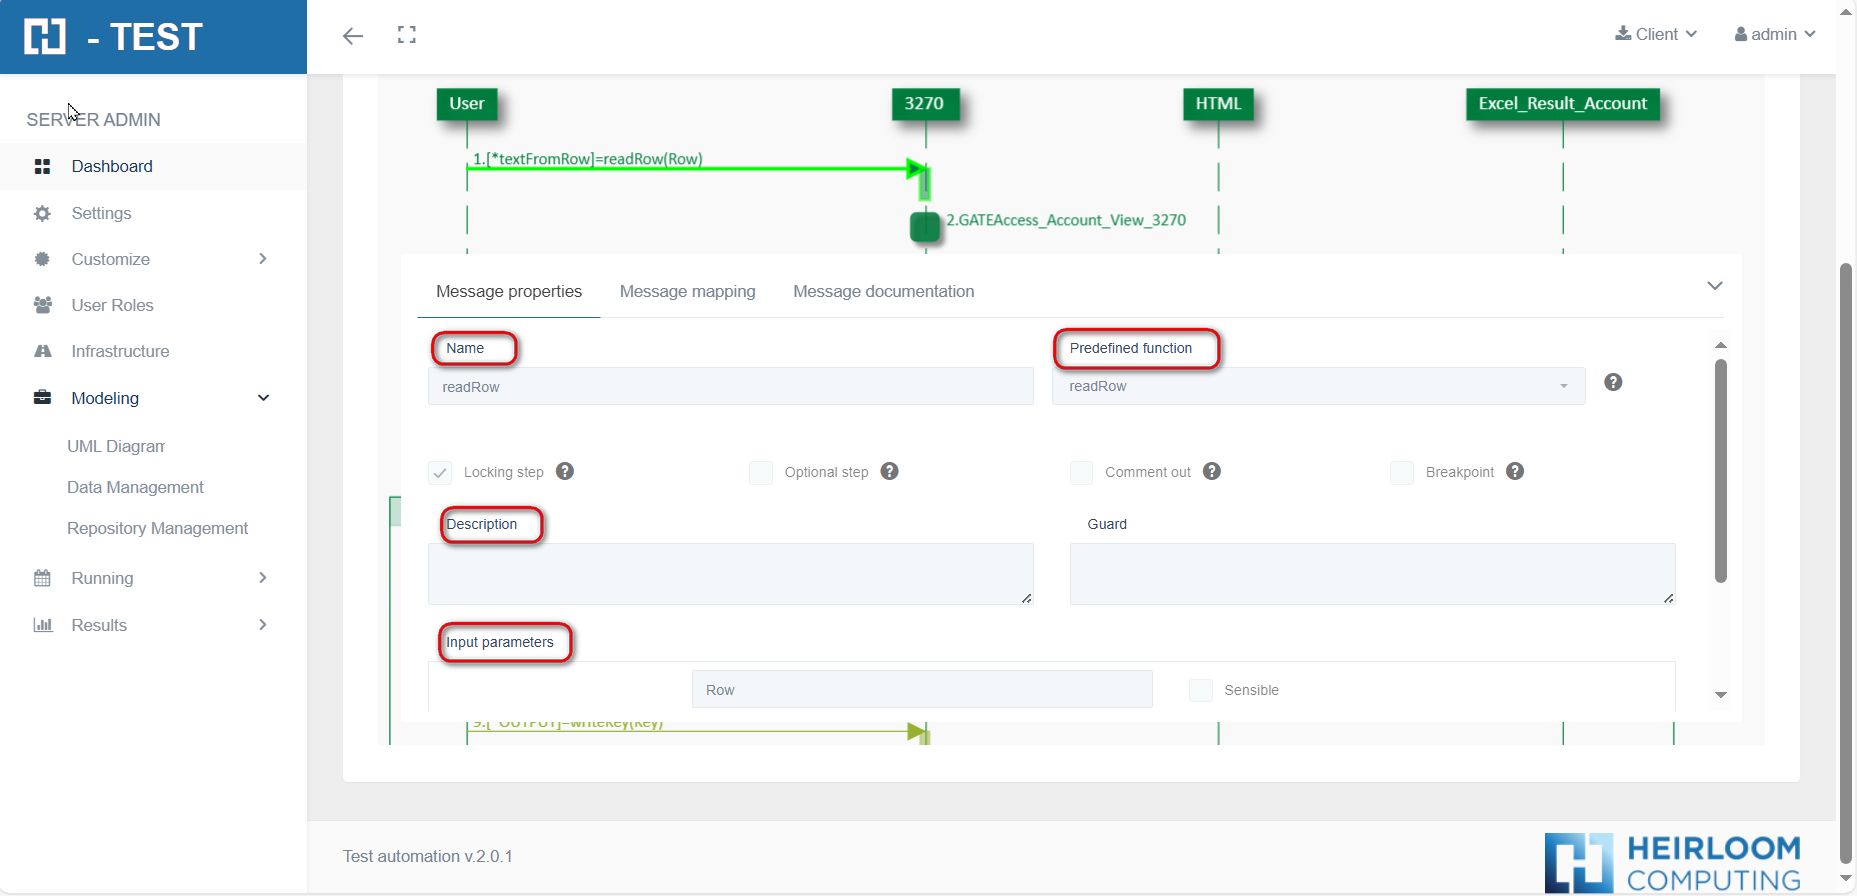
-
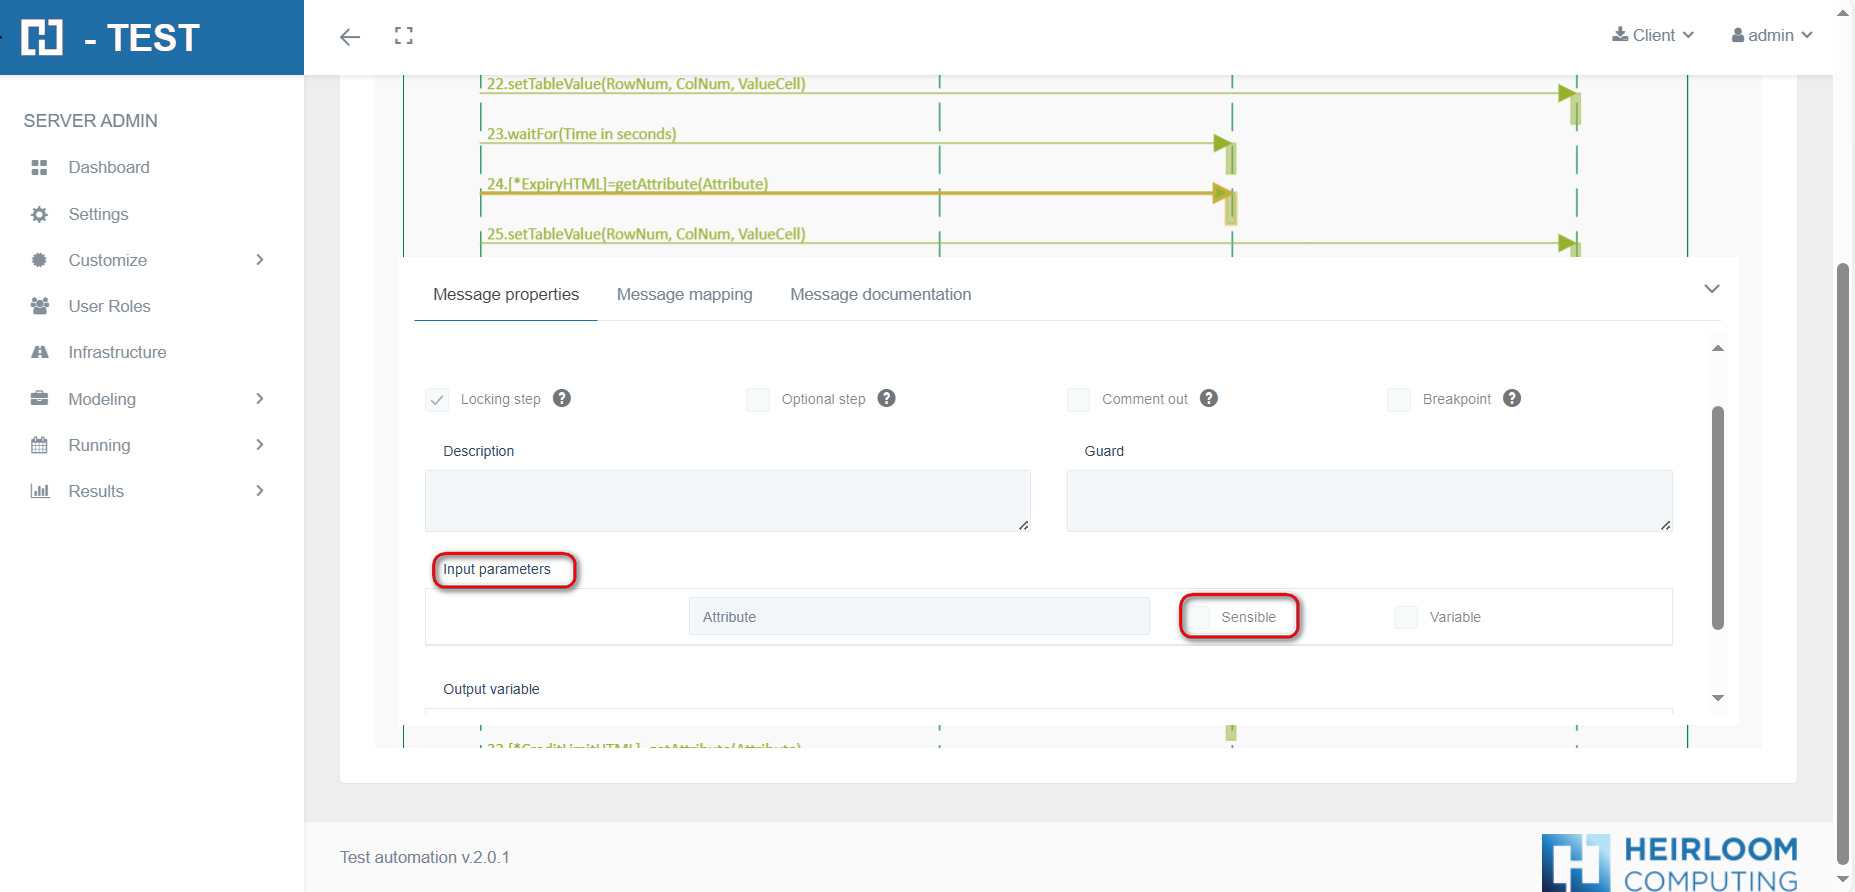
For the Input Parameters there are two important points to take in care:
-
Sensible: In case is checked, it means that the parameter is character's sensible. That is you cannot see the chraracters when you are setting the value for it (later, in the Mapping Tab). E.g, this is very useful for passwords, to hide the entered values.
-
-
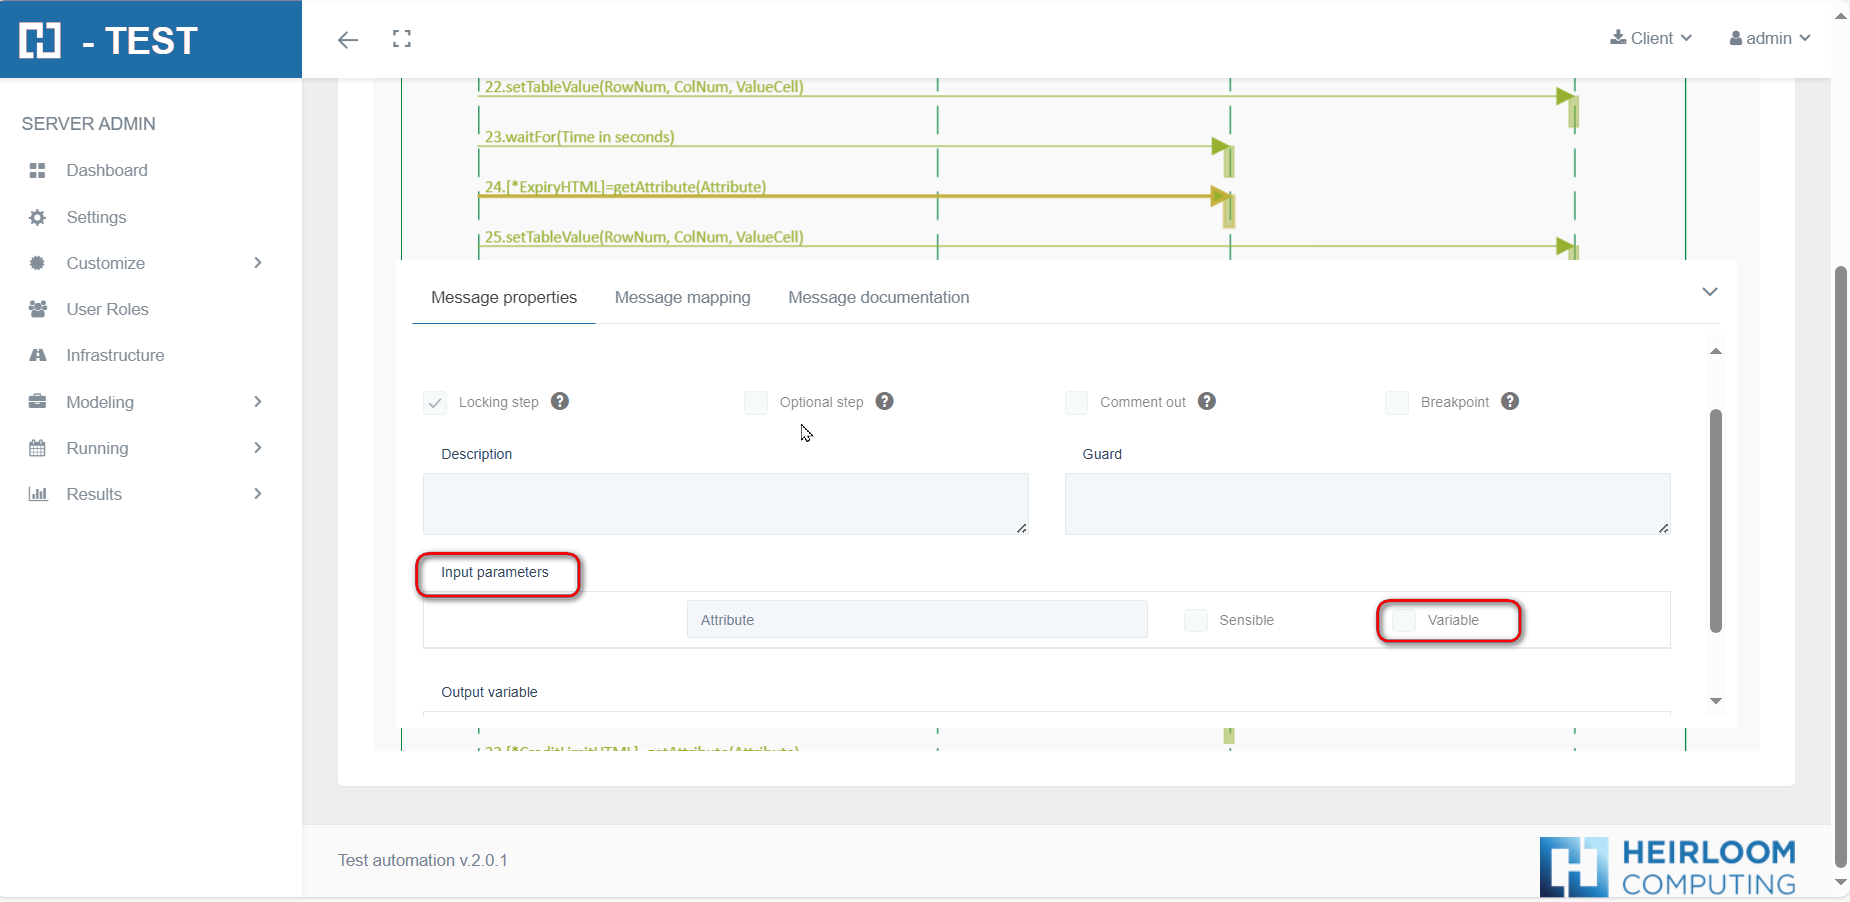
-
Variable: In case is checked, it means that the parameter could be used later in the diagram as a variable. One the checkbox is checked, the symbol # appears to indicate that this name will be a variable since that moment.
-
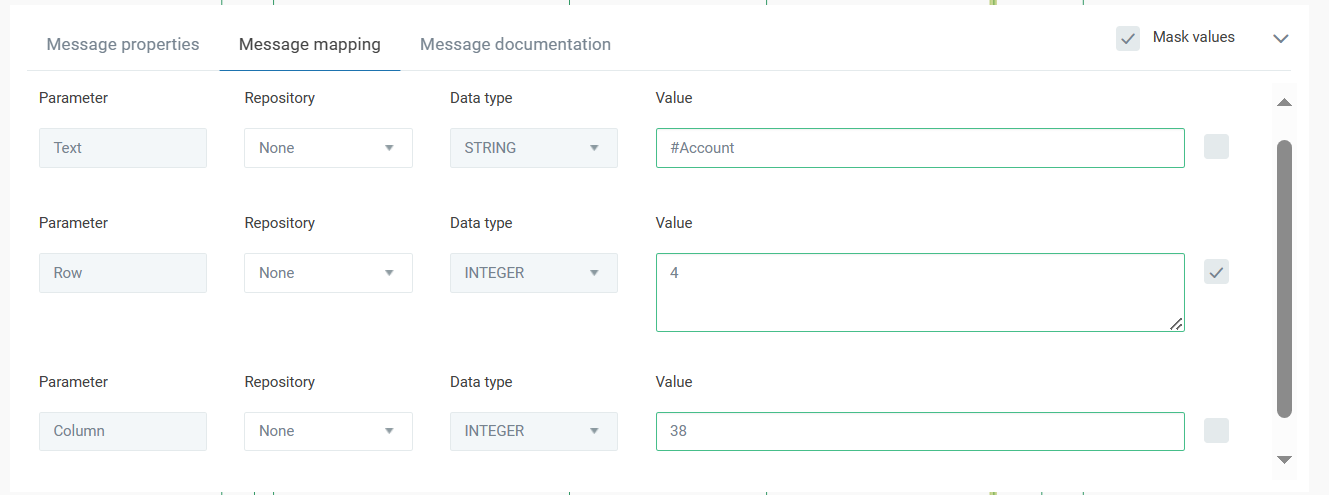
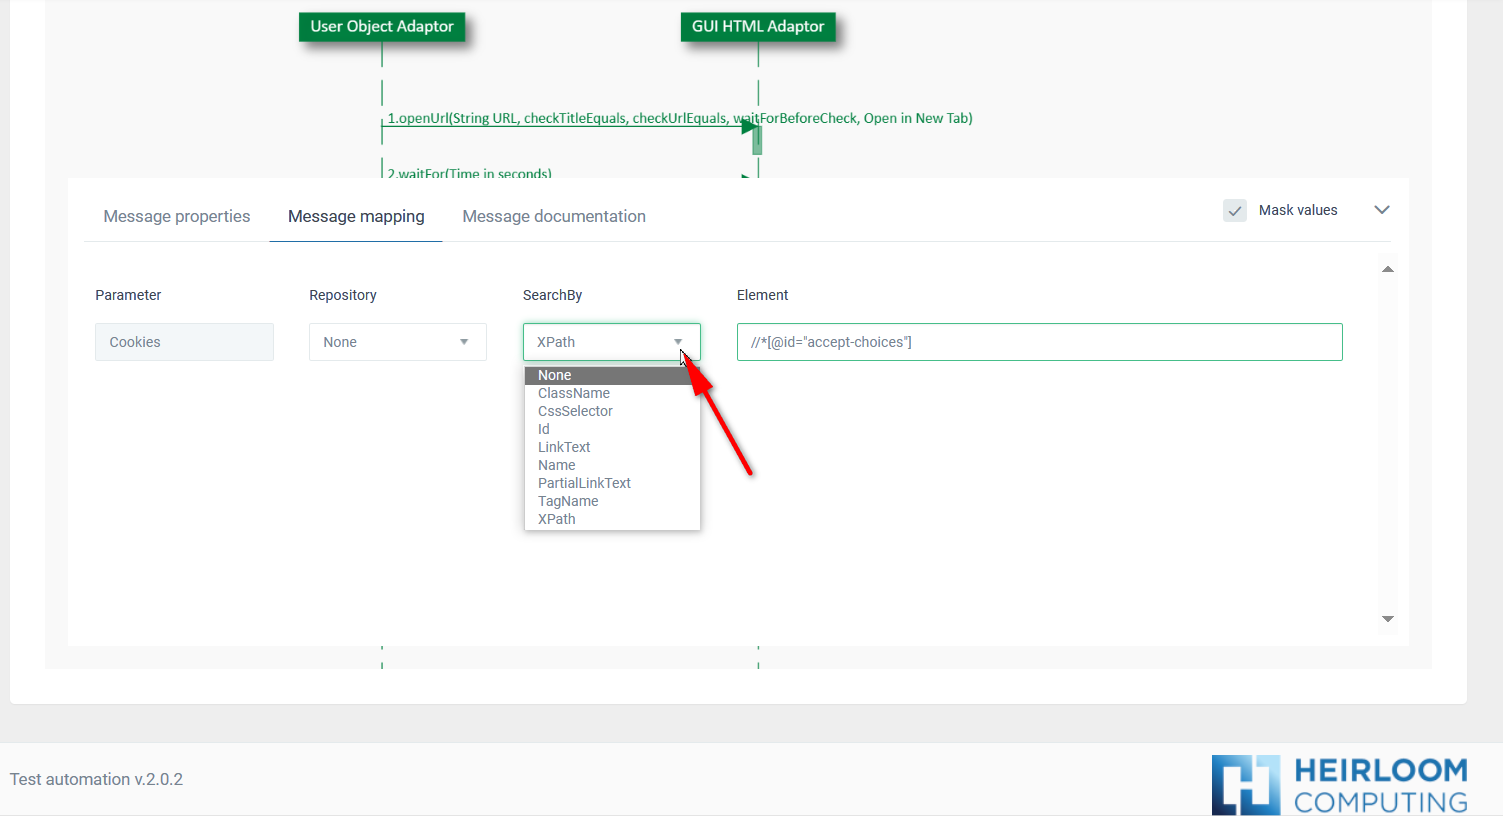
Message Mapping Tab
In the mapping Tab you set the information of the parameters of the message. So, the “SearchBy” is the way to find an element in the parameter section (using tags) and the “Element” is the path you obtain from the real element to interact with.
-
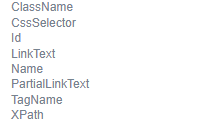
Element: HTML element Identifier (related to the Attribute selected in the Search By field). E.g. XPath Identifier or CssSelector Identifier.
-
Search By: Attribute by which you wonder to find an HTML element. In the search by field you choose one of the following options: ClassName, CssSelector, Id, LinkText, Name, PartialLinkText,TagName or Xpath and those options are tags that the user can obtain for example in the html of a webpage in certain elements. The best way to obtain this information is using the F12 and search for the element we want or using the “selective mapping” we have developed.
A visual example of this is: we want to click the yellow button.
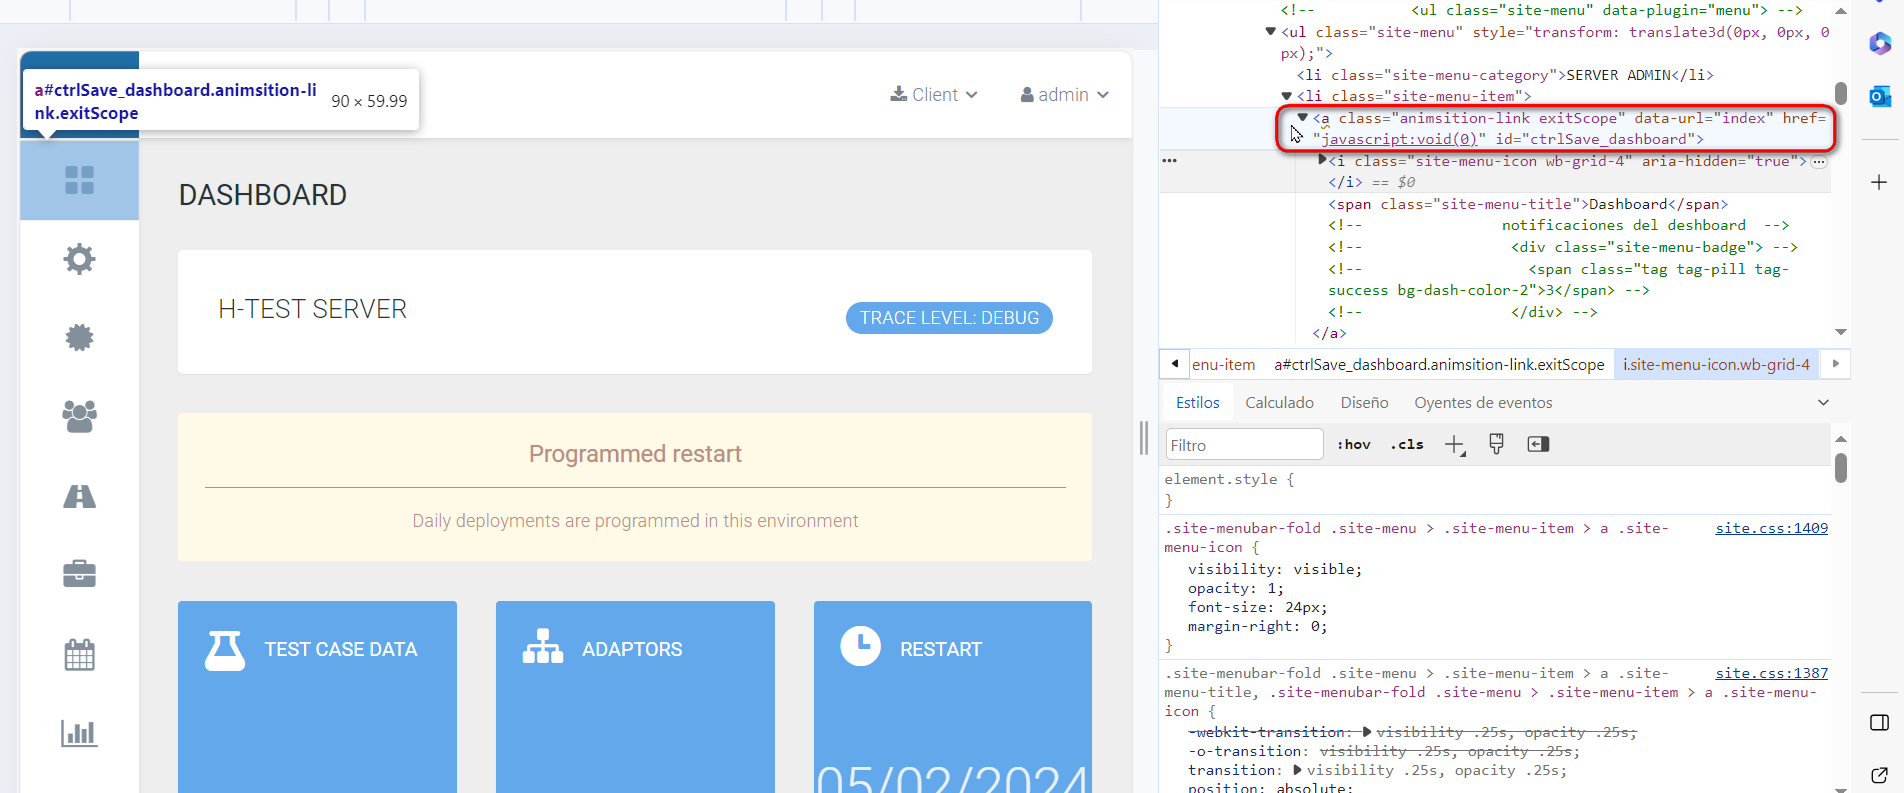
On the other hand, using selective mapping you could pick the class or css…
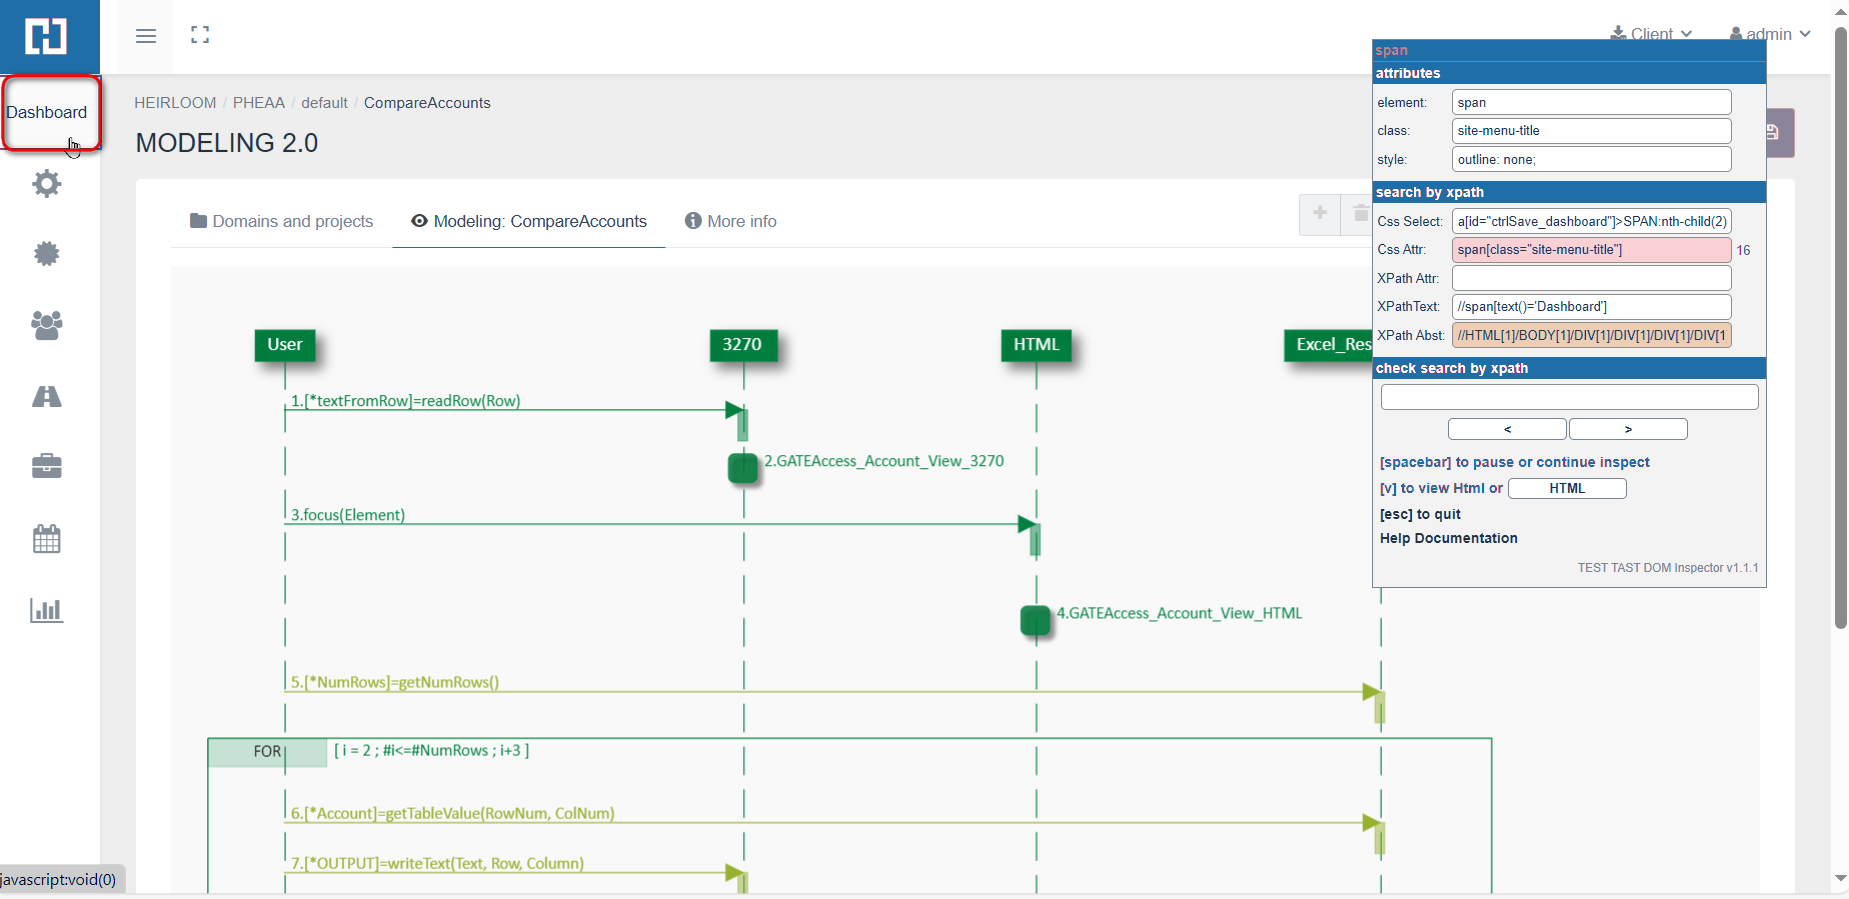
And to finish this, the user have to put the information in the diagram.
- Value (optional): Input Value to enter into the control.
Message documentation Tab
In a H-TEST diagram, the messages (steps) non-reply can be documented using the “Message documentation” tab in the properties of the same.
In this tab it will be possible to document everything that should be stored in the evidence repository tools such as ALM, Confluence, etc.
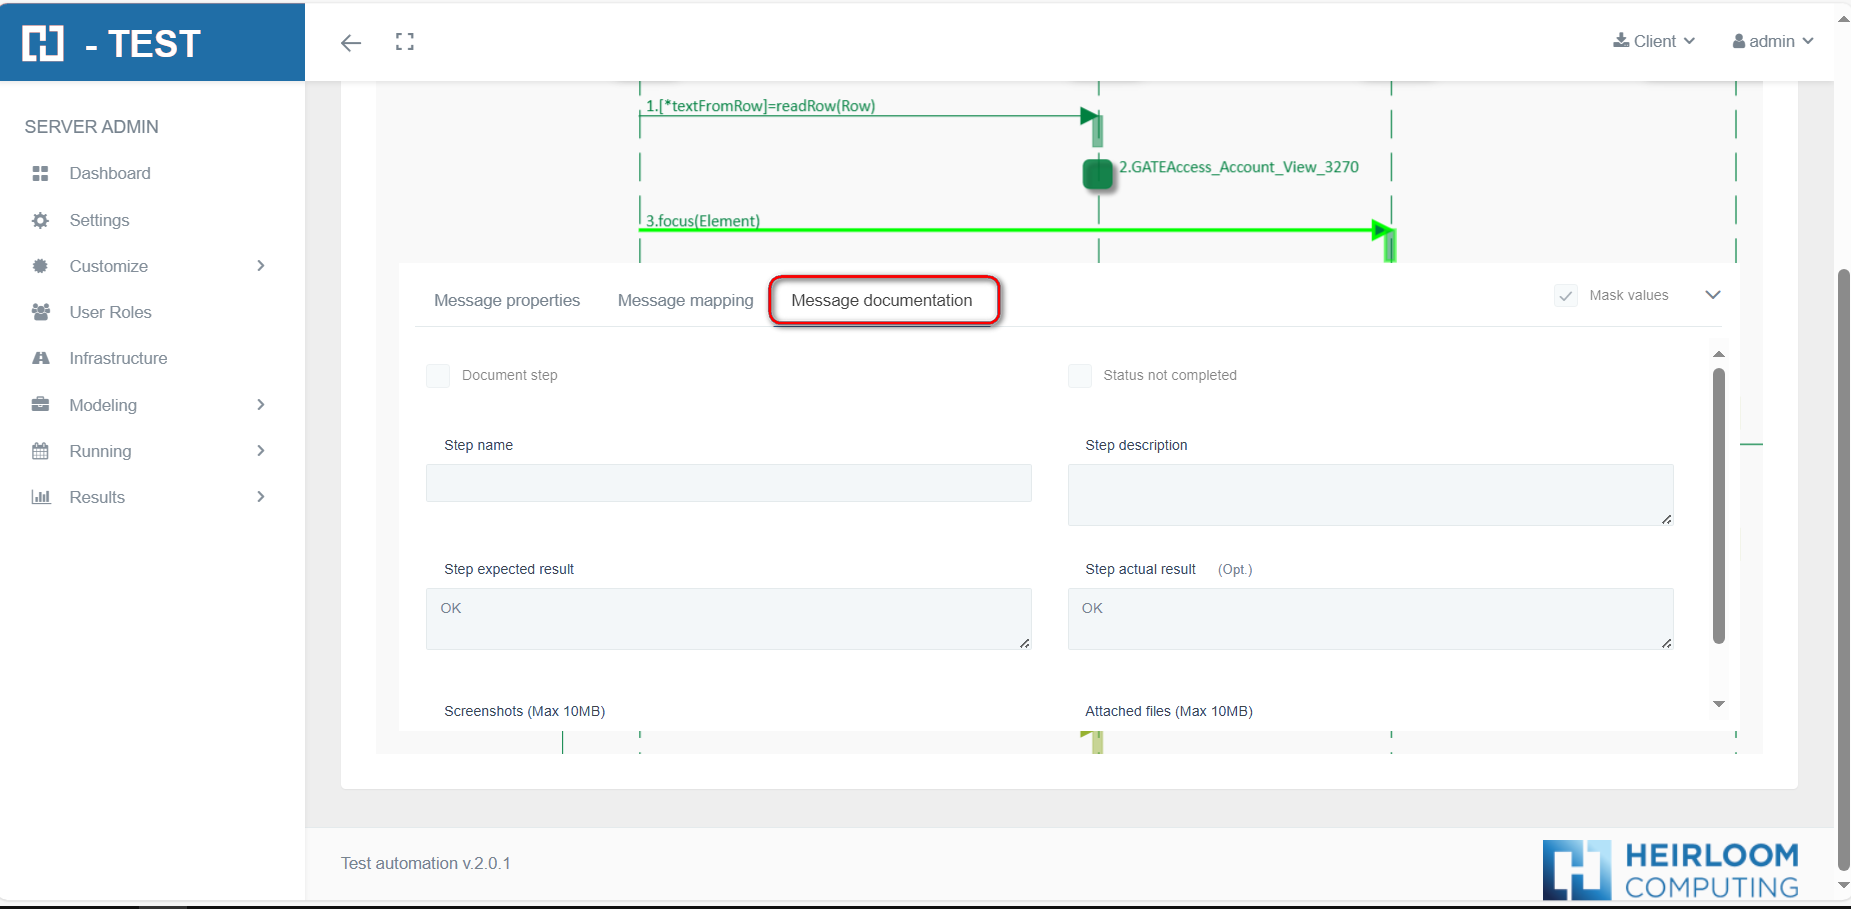
This new tab contains the following elements:
-
StepName
-
Documenting evidences: this check is going to tell us if we should get the evidences (screenshot, files, etc) and if we should register the step in the documentation tool (alm, confluence, etc). Only one screenshot is going to be taken at the end of the execution of all the parameters of the message.
-
Step description: by default, the same description that has been included in the Message Properties, but there will be the possibility to write and change it.
-
Step expected result: by default is just empty or with OK, but you can write whatever you want.
-
Step execution result: at the moment is going to be empty.
-
Attachments: to paste the files into the Documentation tab using you can either use the “Control + V” shortcut and dragging the mouse (mouse down + mouse up).
-
Screenshots: to add an image in the screenshot zone from the clipboard, press “Ctrl + V”; a modal screen will open with the screenshot preview and a field to give it a name. It´s not necessary to be over any element, the paste event works anywhere in the modeling page as long as there is an image in the clipboard.
This feature is not supported on Internet Explorer due to IE limitations, so it needs to be performed using Chrome.
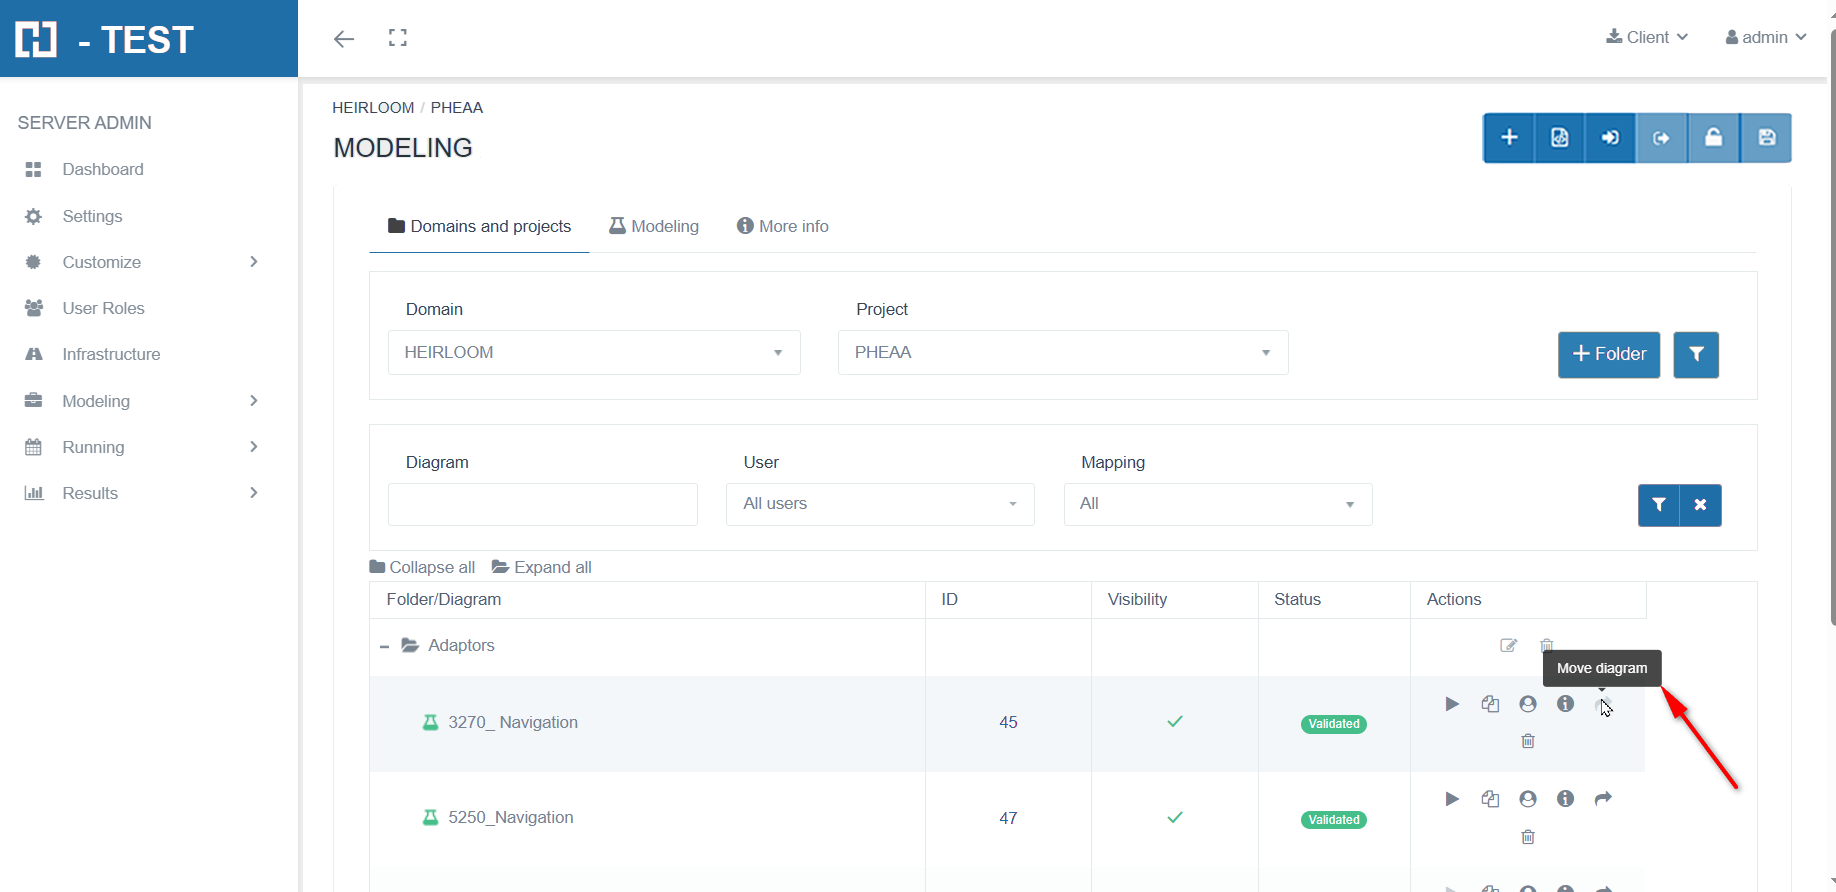
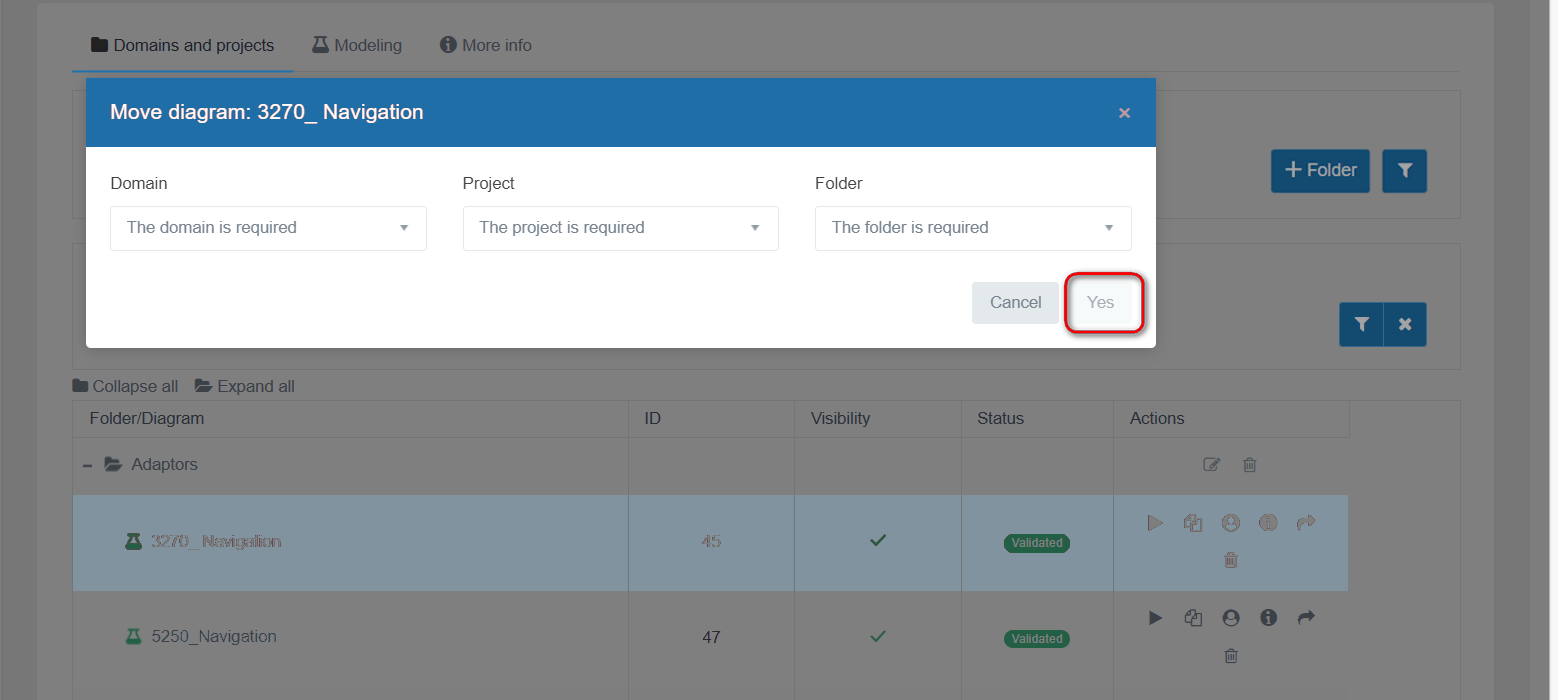
How to Move diagram
This option of the H-TTEST tool allows the user to move a diagram to another folder of any domain and project to which they have access. To be able to use it you have to: Go to Model, click on UML Diagrams. The table is shown, where you have to click on the arrow icon located in the Actions column (fourth element). A pop-up appears, in which you select the domain, the project and the folder where you want to move the diagram. Click on “yes”. The diagram has been moved to that folder.
Global Variables
In a diagram, it is possible to use a set of global variables in all the parts where the help of variables is allowed (object mapping, message mapping, …).
The dropdown of variables (including global ones) will appear when typing the character '#':
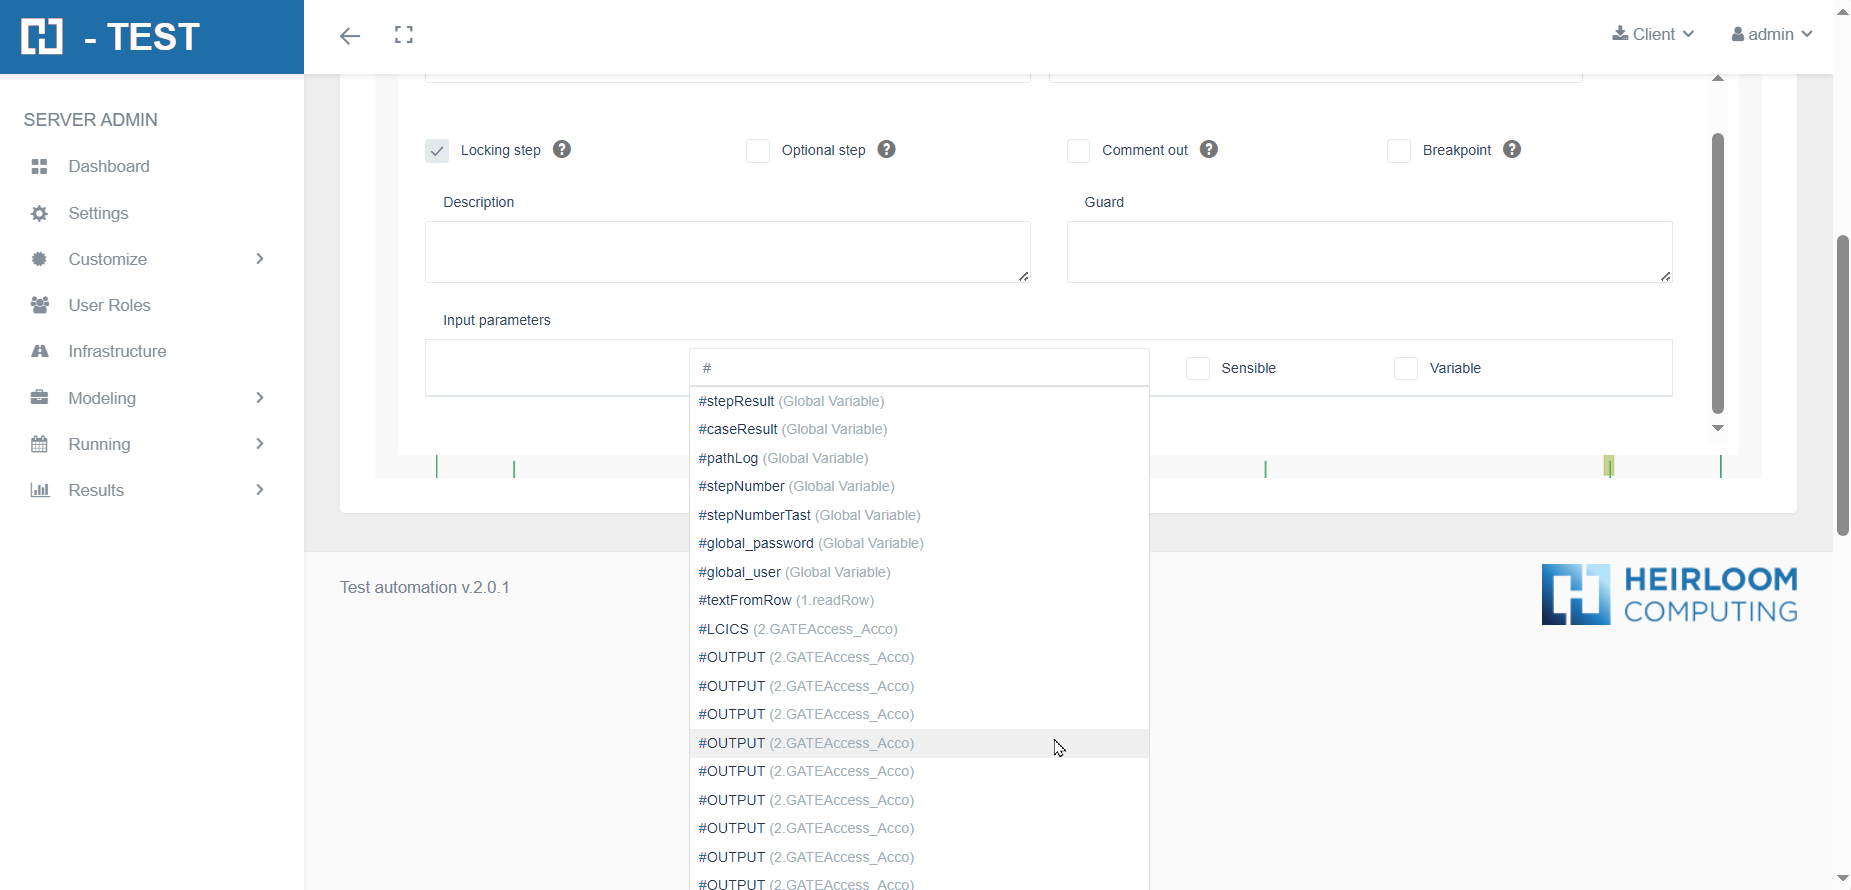
In H-TEST, there are currently these global variables:
-
#caseResult: boolean variable that contains the result of the test case execution:
-
true: when the result of all steps execution of the test case has been correct.
-
false: otherwise; that is, at least the execution of a step of the test case has been failed.
-
-
#global_password: Contains the client access password.
-
#global_user: Contains the client access user
-
#pathLog: contains the path to the folder, which contains the screenshots, log file and other files generated during the execution.
-
#stepNumber: It contains a four-character number (e.g. '0001') and represents the number by which the next step marked to be documented in ALM will be recorded. When a step is recorded in ALM, this number will be incremented for the next step.
-
#stepNumberTast: Contains the old numbering for documenting steps in ALM before the 'stepNumber' variable was available. This format is “Step X.Y…Z Loop I.J…K” where X…Z is the step position, where Y…Z are positions within Gates, and I…K are the loop iteration number, where J…K are the iteration number of nested loops.
-
#stepResult: boolean variable that contains the result of the last step execution in the test case:
-
true: when the result of the last step execution has been correct.
-
false: otherwise; that is, the result of the last step execution has been failed.
-
We can also quickly access the list of global variables through the toolbar. Clicking on the ”?” icon will display “Show Canvas help”.
Next a modal with 3 tabs and choose the “Global Variables” tab which displays the standard global variables available in any diagram.
Predefined Functions - Generation of evidences
Below, the list of predefined functions and the indication of whether they generate evidences or not:
| Predefined Function | Adaptor | Generates evidences |
|---|---|---|
| connect | Database | NO |
| connect_DB | Database | NO |
| dBExecuteStatement | Database | NO |
| dBGetQueryData | Database | YES |
| disconnect_DB | Database | NO |
| getNumColumns | Database | NO |
| getNumRows | Database | NO |
| getTableValue | Database | NO |
| tableRecordCount | Database | NO |
| addSheet | Excel File | NO |
| deleteSheet | Excel File | NO |
| generateFileAsEvidence | Excel File | YES |
| getCellValue | Excel File | NO |
| getColumnByRowSearch | Excel File | YES |
| getExcelSheet | Excel File | NO |
| getNumColumns | Excel File | NO |
| getNumRows | Excel File | NO |
| getNumValueSearchOnColumn | Excel File | NO |
| getRowByColumnSearch | Excel File | YES |
| getTableValue | Excel File | NO |
| getTableValueByColumnName | Excel File | NO |
| getValuesByPosition | Excel File | NO |
| newFile | Excel File | NO |
| setCellValueOneParameter | Ecxel File | NO |
| setColumnValues | Excel File | NO |
| setHeader | Excel File | NO |
| setRowValues | Excel File | NO |
| setTableValue | Excel File | NO |
| setSheet | Excel File | NO |
| vTableLookUp | Excel File | YES |
| vTableLookupArray | Excel File | YES |
| allOptionsAreSelected | GUI HTML | YES |
| clear | GUI HTML | YES |
| clearAndType | GUI HTML | YES |
| click | GUI HTML | YES |
| clickByJavaScript | GUI HTML | YES |
| clickLink | GUI HTML | YES |
| clickPrint | GUI HTML | NO |
| closeAllWindows | GUI HTML | YES |
| closeOthersWindows | GUI HTML | NO |
| closeWindow | GUI HTML | NO |
| countElements | GUI HTML | NO |
| checkbox | GUI HTML | YES |
| checkRadio | GUI HTML | NO |
| doubleClick | GUI HTML | YES |
| deleteAllCookies | GUI HTML | NO |
| deselectAllOptions | GUI HTML | YES |
| fileDownload | GUI HTML | YES |
| fileDownloadDialog | GUI HTML | YES |
| fileUpload | GUI HTML | NO |
| getAttribute | GUI HTML | YES |
| isCurrentUrlContains | GUI HTML | YES |
| isCurrentUrlEquals | GUI HTML | YES |
| isCurrentUrlMatches | GUI HTML | YES |
| isDisplayed | GUI HTML | YES |
| isExist | GUI HTML | YES |
| isSelected | GUI HTML | YES |
| isTitleEquals | GUI HTML | YES |
| isTitleMatches | GUI HTML | YES |
| hasOptionWithValue | GUI HTML | YES |
| javascriptAlertAccept | GUI HTML | NO |
| javascriptAlertCancel | GUI HTML | NO |
| javascriptExecute | GUI HTML | NO |
| login | GUI HTML | YES |
| openUrl | GUI HTML | YES |
| optionWithValueIsEnabled | GUI HTML | YES |
| optionWithValueIsSelected | GUI HTML | YES |
| pressEnter | GUI HTML | YES |
| select | GUI HTML | YES |
| selectAllOptions | GUI HTML | YES |
| selectOption | GUI HTML | NO |
| submit | GUI HTML | YES |
| tableCellValue | GUI HTML | NO |
| tableCellXPathByPosition | GUI HTML | NO |
| tableColumnsNum | GUI HTML | NO |
| tableHLookUpXPath | GUI HTML | NO |
| tableHtml | GUI HTML | YES |
| tableRowsNum | GUI HTML | NO |
| tableVLookUpValue | GUI HTML | NO |
| tableVLookUpXPath | GUI HTML | NO |
| takeScreenshot | GUI HTML | YES |
| type | GUI HTML | YES |
| typeAction | GUI HTML | NO |
| typeKeys | GUI HTML | NO |
| uncheckbox | GUI HTML | YES |
| validateAttribute | GUI HTML | YES |
| waitFor | GUI HTML | NO |
| waitForElement | GUI HTML | NO |
| waitForPageLoad | GUI HTML | NO |
| newConnect_Script | Script Generic | NO |
| execute_Script | Script Generic | YES |
| disconnect_Script | Script Generic | NO |
| connect_Script | Script Generic | NO |
| closeFile | Text Files | NO |
| containsText | Text Files | NO |
| countFileLine | Text Files | NO |
| countTextFile | Text Files | NO |
| deleteFtpFile | Text Files | NO |
| deleteSftpFile | Text Files | NO |
| generateFileAsEvidence | Text Files | YES |
| getFileText | Text Files | NO |
| getFtpFile | Text Files | NO |
| getLineLength | Text Files | NO |
| getNumColumns | Text Files | NO |
| getOwner | Text Files | NO |
| getReadLine | Text Files | NO |
| getSize | Text Files | NO |
| getSftpFile | Text Files | NO |
| getTableValue | Text Files | NO |
| getTextFileData | Text Files | YES |
| lineContainsText | Text Files | NO |
| loadCsvData | Text Files | YES |
| newFile | Text Files | NO |
| openFile | Text Files | NO |
| openNewFile | Text Files | NO |
| putFtpFile | Text Files | NO |
| putSftpFile | Text Files | NO |
| replaceText | Text Files | NO |
| writeEnter | Text Files | NO |
| writeTo | Text Files | NO |
| assertion | User Object | NO |
| compareParameters | User Object | NO |
| compareVariables | User Object | NO |
| copyFile | User Object | NO |
| dateAddition | User Object | NO |
| dateDifference | User Object | NO |
| dateWeekDay | User Object | NO |
| executeCommand | User Object | NO |
| executeJavaScript | User Object | NO |
| failTest | User Object | NO |
| getCurrentDate | User Object | NO |
| getCurrentDateAsDate | User Object | NO |
| getCurrentDateAsString | User Object | NO |
| isExistVariable | User Object | NO |
| manualH-TEST | User Object | YES |
| removeVariable | User Object | NO |
| replaceAll | User Object | NO |
| saveRepositoryAsEvidence | User Object | YES |
| sendKeys | User Object | NO |
| sendKeysCombination | User Object | NO |
| sendKeysPaste | User Object | NO |
| setArrayVariable | User Object | NO |
| setVariable | User Object | NO |
| systemCloseProgram | User Object | NO |
| takeScreenshot | User Object | YES |
| waitFor: | User Object | YES |
| deleteRest | API/WebService | YES |
| getALLXMLElementValueByTagName | API/WebService | YES |
| getCookieValue | API/WebService | NO |
| getHeaderValue | API/WebService | NO |
| getHTMLElementValueByXPath | API/WebService | NO |
| getJSONElementValueByJsonPath | API/WebService | NO |
| getJSONElementValueByTagName | API/WebService | NO |
| getRest | API/WebService | YES |
| getResponseStatus | API/WebService | NO |
| getResponseTime | API/WebService | NO |
| getXMLElementValueByXPath | API/WebService | NO |
| getXMLElementValueByTagName | API/WebService | NO |
| patchRest | API/WebService | YES |
| postRest | API/WebService | YES |
| putRest | API/WebService | YES |
| responseBodyContainsText | API/WebService | NO |
| setNoneAuthentication | API/WebService | NO |
| setBasicAuthentication | API/WebService | NO |
| setBearerTokenAuthentication | API/WebService | NO |
| setDigestAuthentication | API/WebService | NO |
| clearAndWriteField | Host 3270 | YES |
| clearField | Host 3270 | YES |
| containsText | Host 3270 | YES |
| getLenghField | Host 3270 | NO |
| nextScreen | Host 3270 | YES |
| previousScreen | Host 3270 | YES |
| readField | Host 3270 | YES |
| readRow | Host 3270 | YES |
| readScreen | Host 3270 | YES |
| readScreen | Host 3270 | YES |
| rowContainsText | Host 3270 | YES |
| waitCRC | Host 3270 | NO |
| waitFor | Host 3270 | NO |
| waitForChange | Host 3270 | YES |
| waitForText | Host 3270 | YES |
| writeAfterLabel | Host 3270 | YES |
| writeBeforeLabel | Host 3270 | YES |
| writeField | Host 3270 | YES |
| writeKey | Host 3270 | YES |
| writeKeyUntilFind | Host 3270 | YES |
| writeText | Host 3270 | YES |
| checkTextInSlide | NO | |
| checkTextOnDocument | NO | |
| checkTextOnPage | NO | |
| checkTextOnPageArea | NO | |
| generateFileAsEvidence | YES | |
| getGetTextByPageArea | YES | |
| getNumPages | NO | |
| getNumWhitePages | NO | |
| getPageAsImage | YES | |
| getPageText | YES | |
| getTextCountOnDocument | NO | |
| getTextCountOnPage | NO | |
| isPageWhite | NO | |
| generateFileAsEvidence | XML | YES |
| getElementAttrTextByXPath | XML | NO |
| getElementsCountByTagName | XML | NO |
| getElementsCountByXPath | XML | NO |
| getElementsTextByTagName | XML | YES |
| getElementsTextByXPath | XML | YES |
| getElementTextByTagName | XML | NO |
| getElementTextByXPath | XML | NO |
| replaceElementAttrTextByXPath | XML | NO |
| replaceElementTextByTagName | XML | NO |
| replaceElementTextByXPath | XML | NO |
| saveAs | XML | NO |
| saveXml | XML | NO |
| xmlToString | XML | NO |
| executeAllServiceOperations | SOAP UI | YES |
| executeAllTestSuite | SOAP UI | YES |
| executeServiceOperation | SOAP UI | YES |
| executeTestCase | SOAP UI | YES |
| executeTestStep | SOAP UI | YES |
| executeTestSuite | SOAP UI | YES |
| executePostmanCollection | Postman Collection | YES |
| getResponseBody | Postman Collection | YES |
| getResponseStatusCode | Postman Collection | YES |
Shortcuts
You can use the following keyboard shortcuts in the canvas:
| Shortcut | Description |
|---|---|
| Esc | Close menus and selects the pointer. |
| Supr | Deletes elements if there is one or more elements are selected. |
| Alt + 9 | Unlock diagrama for edition. |
| Alt + P | Selects the pointer tool. |
| Alt + O | Selects the “Adaptor” tool. |
| Alt + M | Selects the “Message” tool. |
| Alt + R | Selects the “Reply message tool”. |
| Alt + G | Selects the “Gate” tool. |
| Alt + A | Selects the “Combined Fragment: ALT” tool. |
| Alt + D | Selects the “Combined Fragment: DO WHILE” tool. |
| Alt + W | Selects the “Combined Fragment: WHILE” tool. |
| Alt + F | Selects the “Combined Fragment: FOR” tool. |
| Alt + E | Selects the “Combined Fragment: FOR EACH” tool. |
| Alt + S | Selects the “Subtestcase” tool. |
| Ctrl + C | Copy selected elements. |
| Ctrl + V | Paste copied elements. |
| Ctrl + Shift + V | Paste copied items on the position of the cursor. |
| Ctrl + Z | Undoes some actions such as: Delete elements, Redistribute diagram, etc… |
| Ctrl + Shift + F | Toggle comment out selected items (messages/gates). |
| Double click | Edit element: double click on a diagram element to edit its properties. |
| Right button | Context menu: by right-clicking on an element, you can access the dynamic context menu. The options of this menu vary and can appear active/not active, depending on the currently selected elements. |
| Mouse Wheel | Zoom in/Zoom out: Ro ll the mouse wheel forward or backward to zoom in or zoom out the canvas respectively. |
| Shift + click | Multiple selection: press “shift” key while click on items to select them. |
| Shift + drag | Multiple drag&drop: press “shift” key while drag and drop all selected items |
| Click + drag | Move diagram: click on an empty diagram place while drag the diagram to any direction to move it. |
Multiple Selection of Messages
Selection of objects in the Canvas
By Selecting an object, we can then perform other actions with it (eg delete it, etc...).
Simple selection
To select an object in the canvas, just click on the object (in any of its parts, including the text). To deselect it, just click on an “empty” area of the canvas.
Multiple selection
To select several objects in the canvas, we will press shift-click on the different objects that we want to select. This allows us to perform actions on that group of selected objects (eg delete them, move them, copy them, etc...).
To deselect them, just click on an “empty” area of the canvas. In multiple selection there is no limitation regarding the type of selected objects. All types of objects can be selected at the same time (messages, gates, fragments…).
Selective Mapping
H-TEST has an important help when mapping objects and messages in a diagram: Selective Mapping.
The configuration, how to use the functionality,functionality and some considerations arehave been explained inabove thein: documentSelective below:Mapping
TAST Selective Mapping 2024.doc
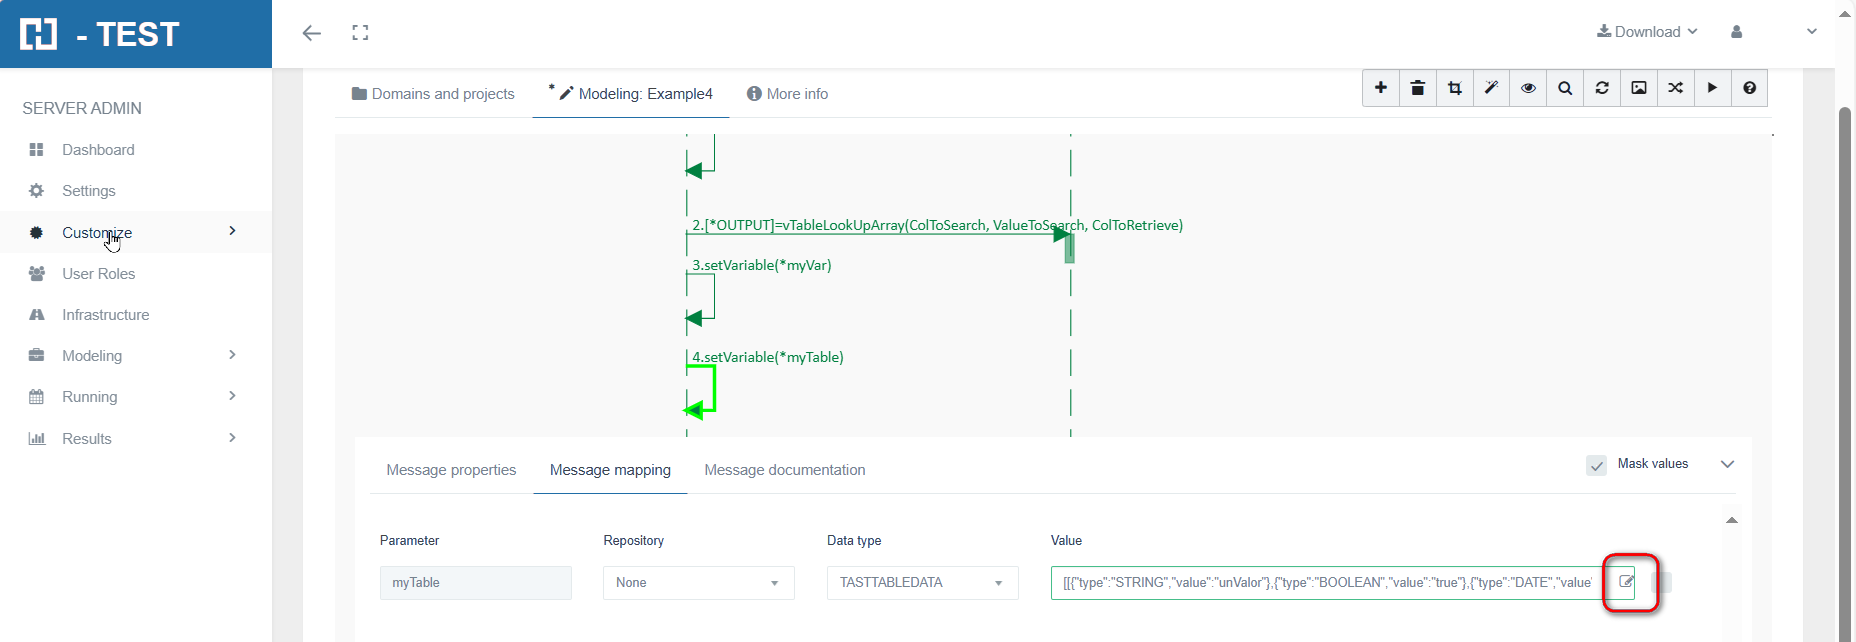
Tast Table Data Management
In an UML diagram, H-TEST allows the use of variables of a specific type of table, called TastTableData.
These variables can be used with practically all the adaptors available in H-TEST (HTML GUI, Excel Files, Database, …). They can be used in the “Value” box of a Predefined Function or in Javascript.
Once the TastTableData variables have been created (as output variables), they can be used as input variables in subsequent messages. The way to use them in a “Value box” is:
#TastTableDataVariableName.functionName(params…). From javascript, you will use the syntax functionName(params…)
The functions currently available are:
| Output | Function | Description |
|---|---|---|
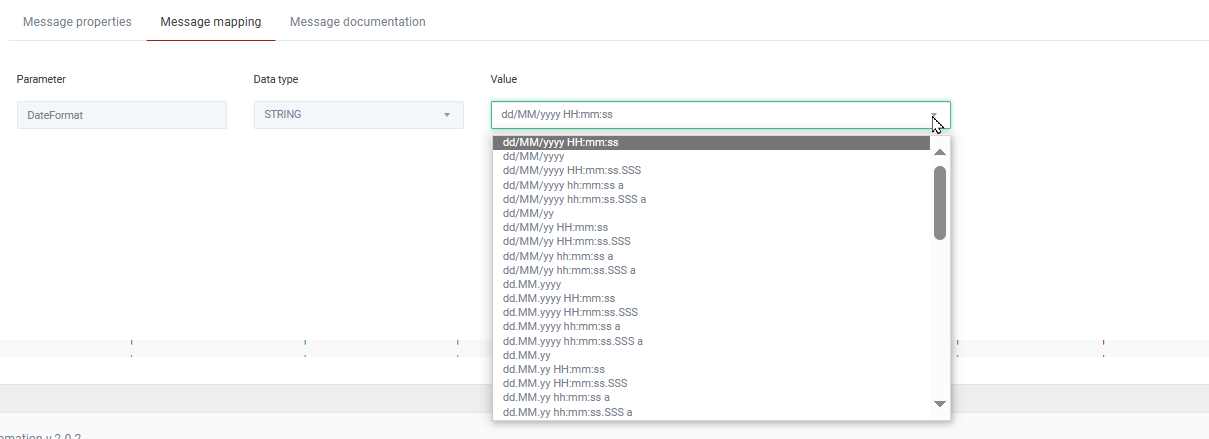
| String | getDateWithFormatFromCellValue(int row, int column, String format) |
From a cell (identified by column) whose content is of type DATE (dd/MM/yyyy HH:mm:ss) obtains this value or content in the indicated format. This format must be enclosed in quotation marks.
|
| int | getNumColumns() | Returns an integer with the number of columns. |
| int | getNumRows() | Returns an integer with the number of rows. |
| String | getStringValue() | Returns a string containing the content of the table separating cells with | and rows with ||. |
| TastRowTableData | getTheRow(int index) | Returns a row. |
| N/A | addRowData(TastRowTableData rowData) | Adds a row at the end of the table. |
| TastRowTableData | getTheColumn(int index) | Returns a column (as a row). |
| TastDataGeneric | getCellValue(int row,int column) | Returns the value of a specific cell. |
| TastDataGeneric | getTableValueByColumnName(int rowNum, String columnName) | Returns the value of a cell identified by row number and Column name. |
| N/A | setTableValue(int row, int column, String value) | Allows to add a value to a specific cell. The value can be a string, Float or Boolean value, either contained in a variable or hardcoded: |
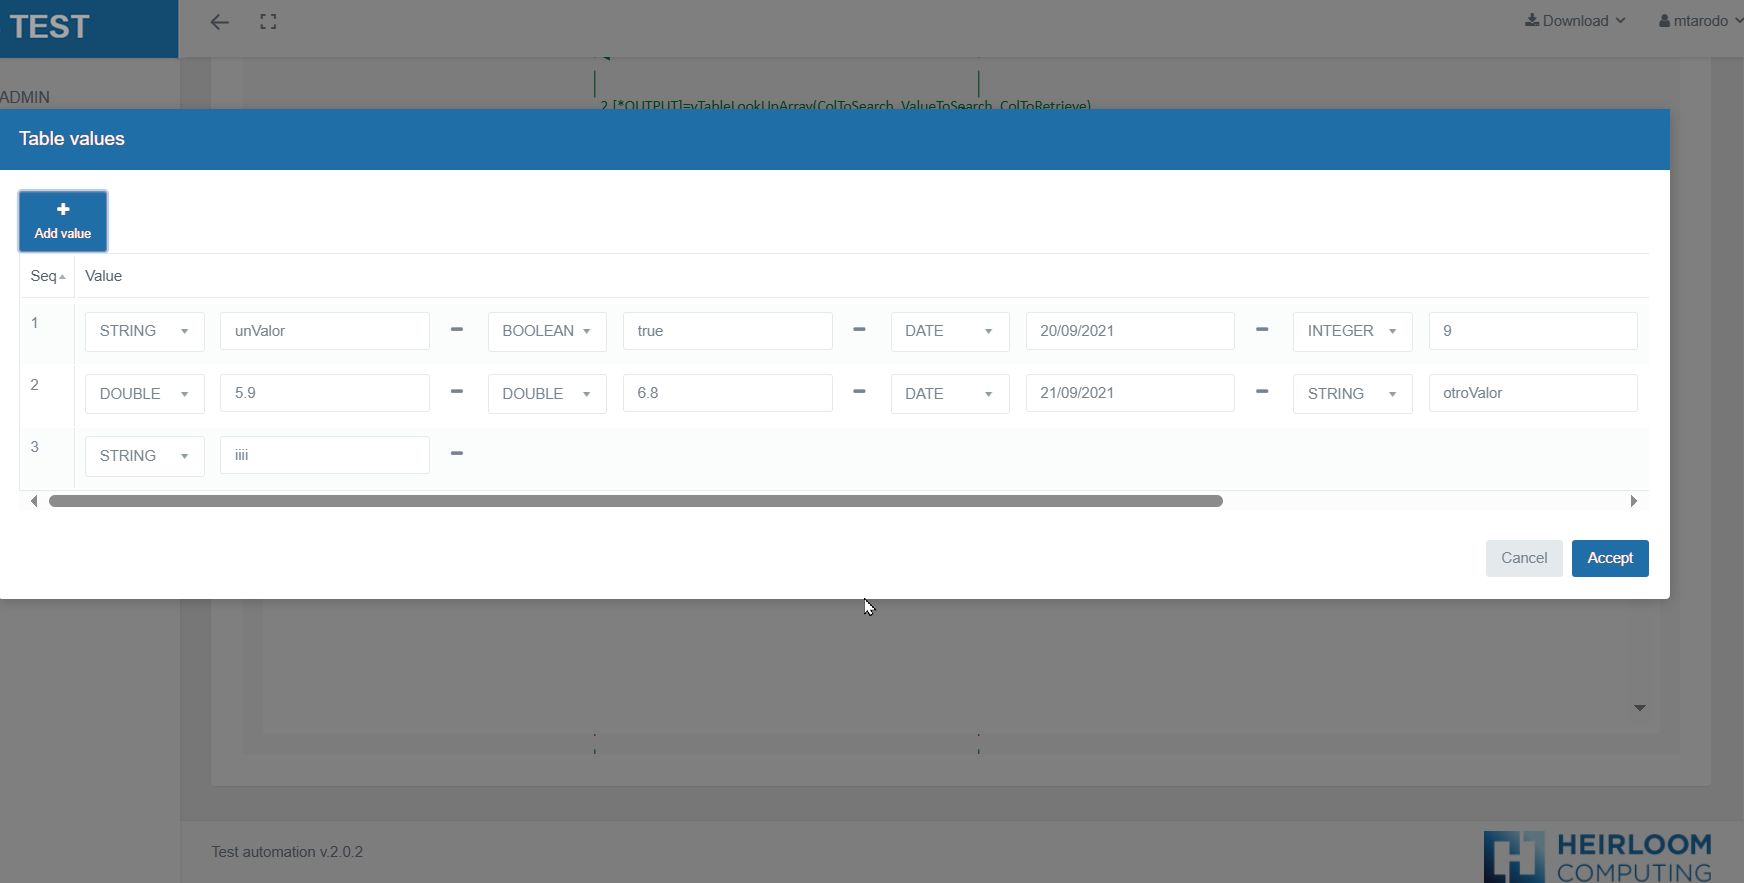
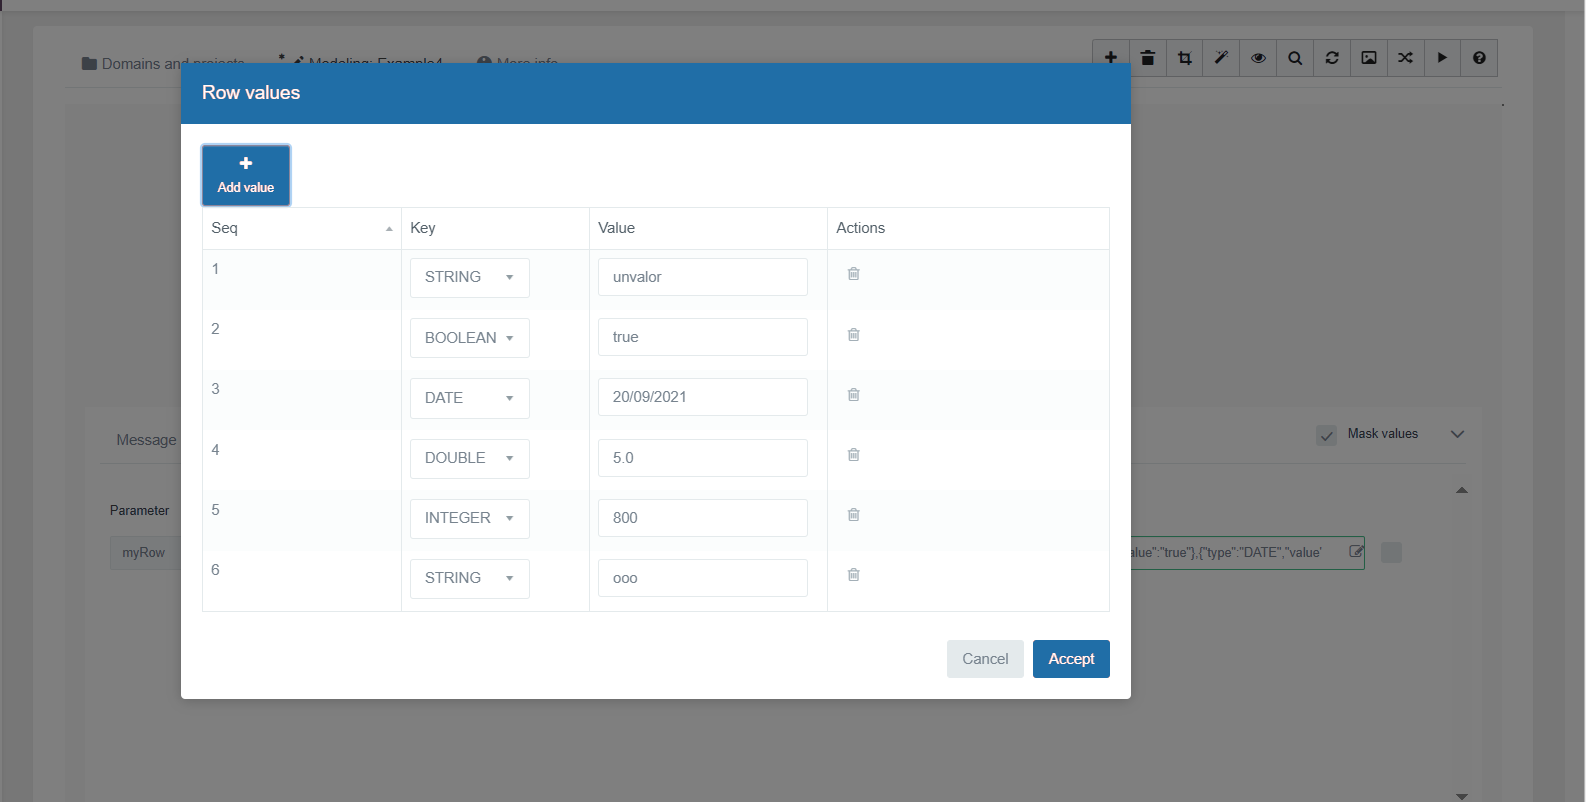
TastTableData is a multidimensional list, or a list of lists. By placing a list inside other lists, we can store information in rows and columns. Let's show an example:
With the SetVariable function we are going to define a variable of type TastTableData.
The different rows appear, containing five columns, each of one type. More rows can be added.
To get all the information that is on the first page of the Excel file, we can use the getExcelSheet function and it is stored in this variable TastOutputTable.
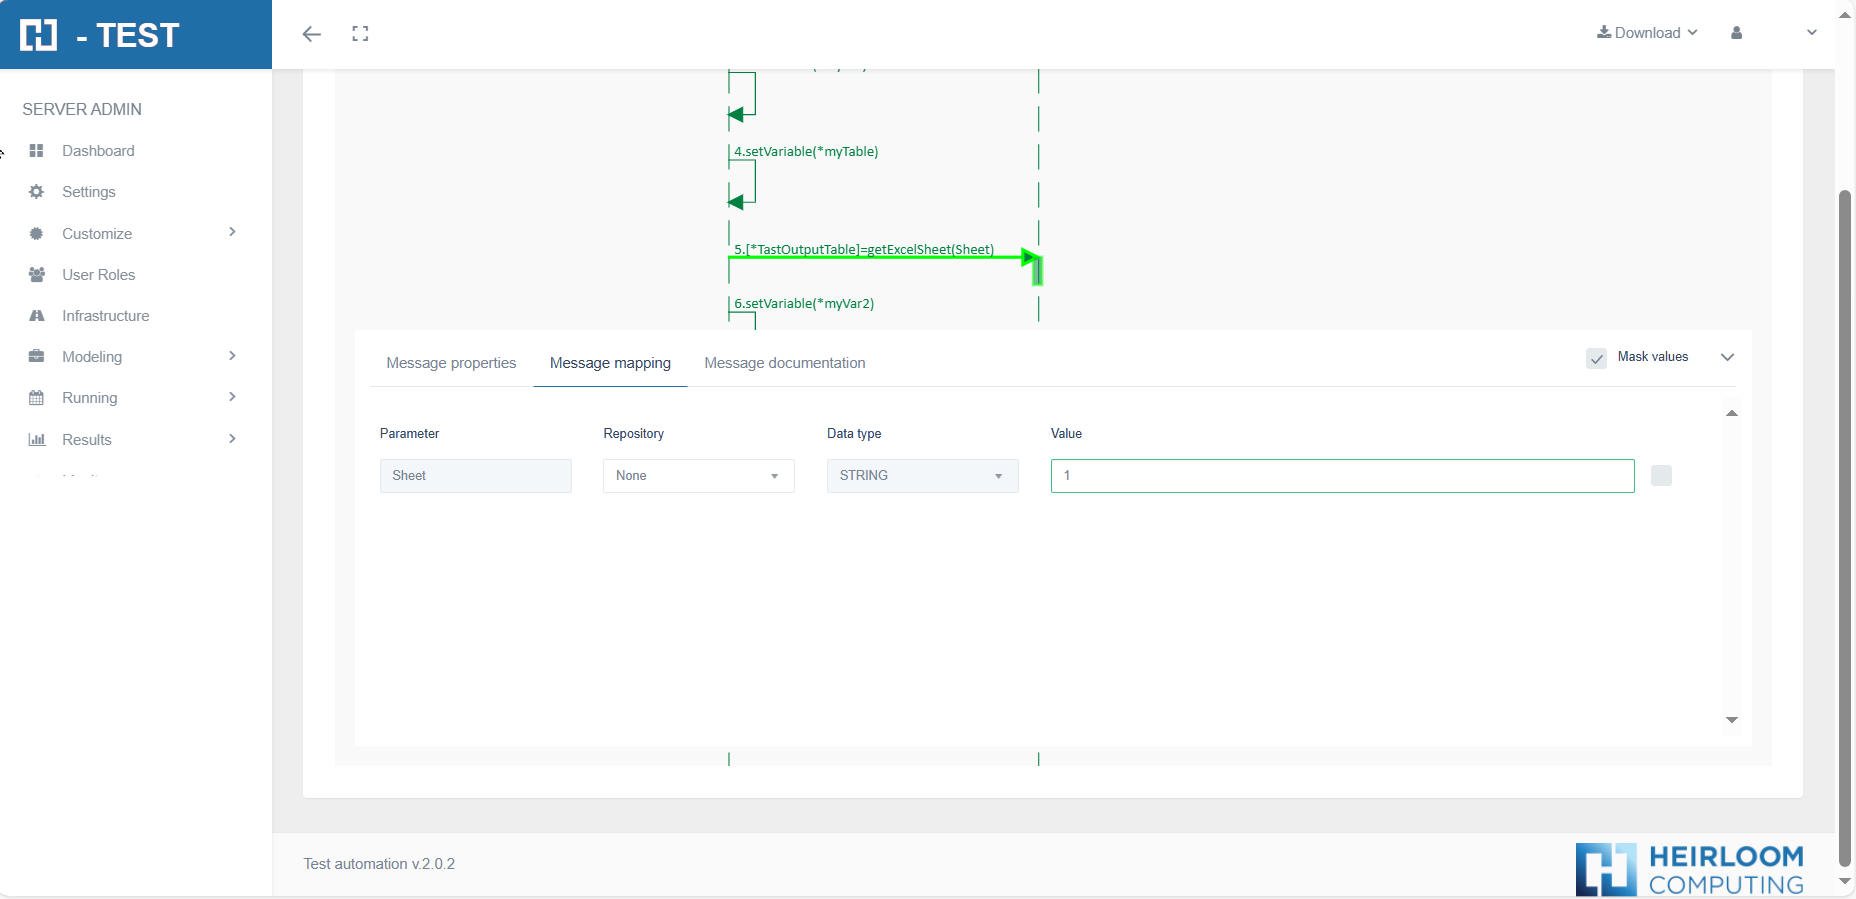
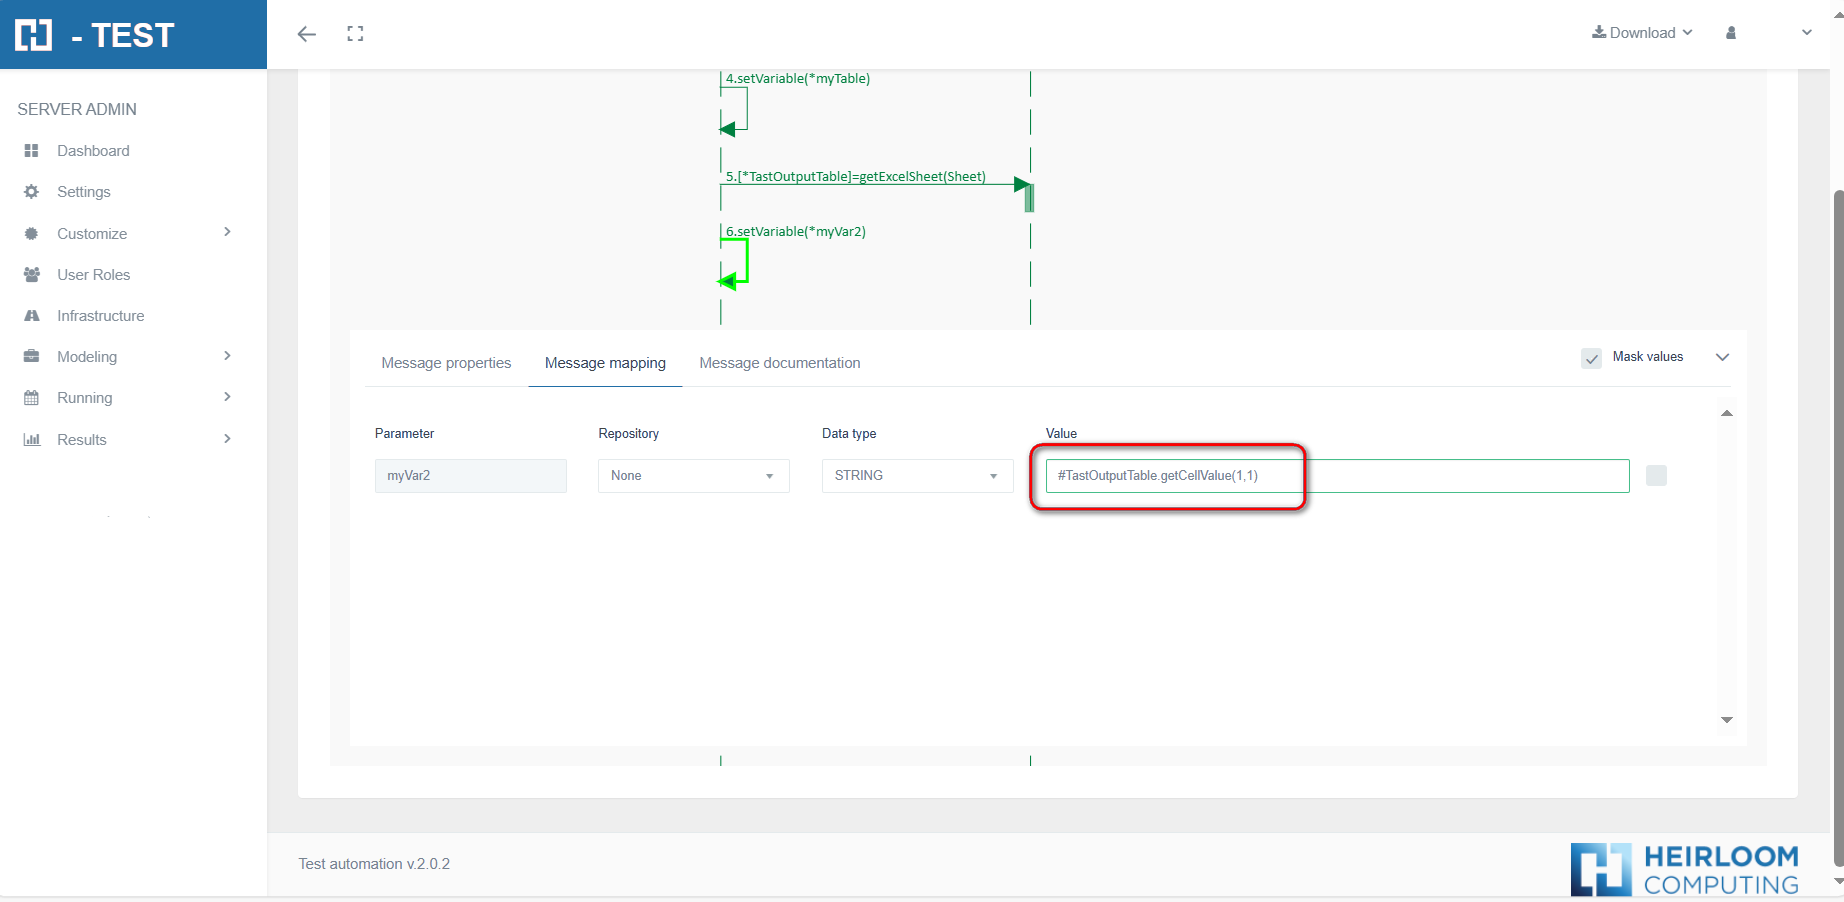
Then, in order to work with TastOutputTable we can use the functions or methods described above.
Tast Row Data Management
H-TEST allows the use of variables of a specific type of row, called TastRowValues.
These variables can be used with practically all the adaptors available in H-TEST (HTML GUI, Excel Files, Database, …). They can be used in the “Value” box of a Predefined Function or in Javascript.
Once the TastRowValues variables have been created (as output variables), they can be used as input variables in subsequent messages.
The way to use them in a “Value box” is: #TastRowDataVariableName.functionName(params…) From javascript, you will use the syntax functionName(params…)
In order to be able to work with these variables, some methods or Predefined Functions have been created. The functions currently available are:
| Output | Function | Description |
|---|---|---|
| N/A | addCellValue(String value) | Allows to add a cell at the end of the TastRowValues. |
| String | getCellValue(int index) | Returns the content of a specific cell. |
| String | getDateWithFormatFromCellValue(int row, int column, String format) |
From a cell (identified by column) whose content is of type DATE (dd/MM/yyyy HH:mm:ss) obtains this value or content in the indicated format. This format must be enclosed in quotation marks. |
| int | getLength() | Returns the number of cells of the TastRowValues. |
| String | getStringValue() | Returns the content of the row separating cells with | |
TastRowTableData is a collection of data in the form of a list that can be repeated. The number of elements is not fixed or limited in advance. To access the elements an index is used which indicates the position of the element in the collection. This type of data is required in several Adapters.
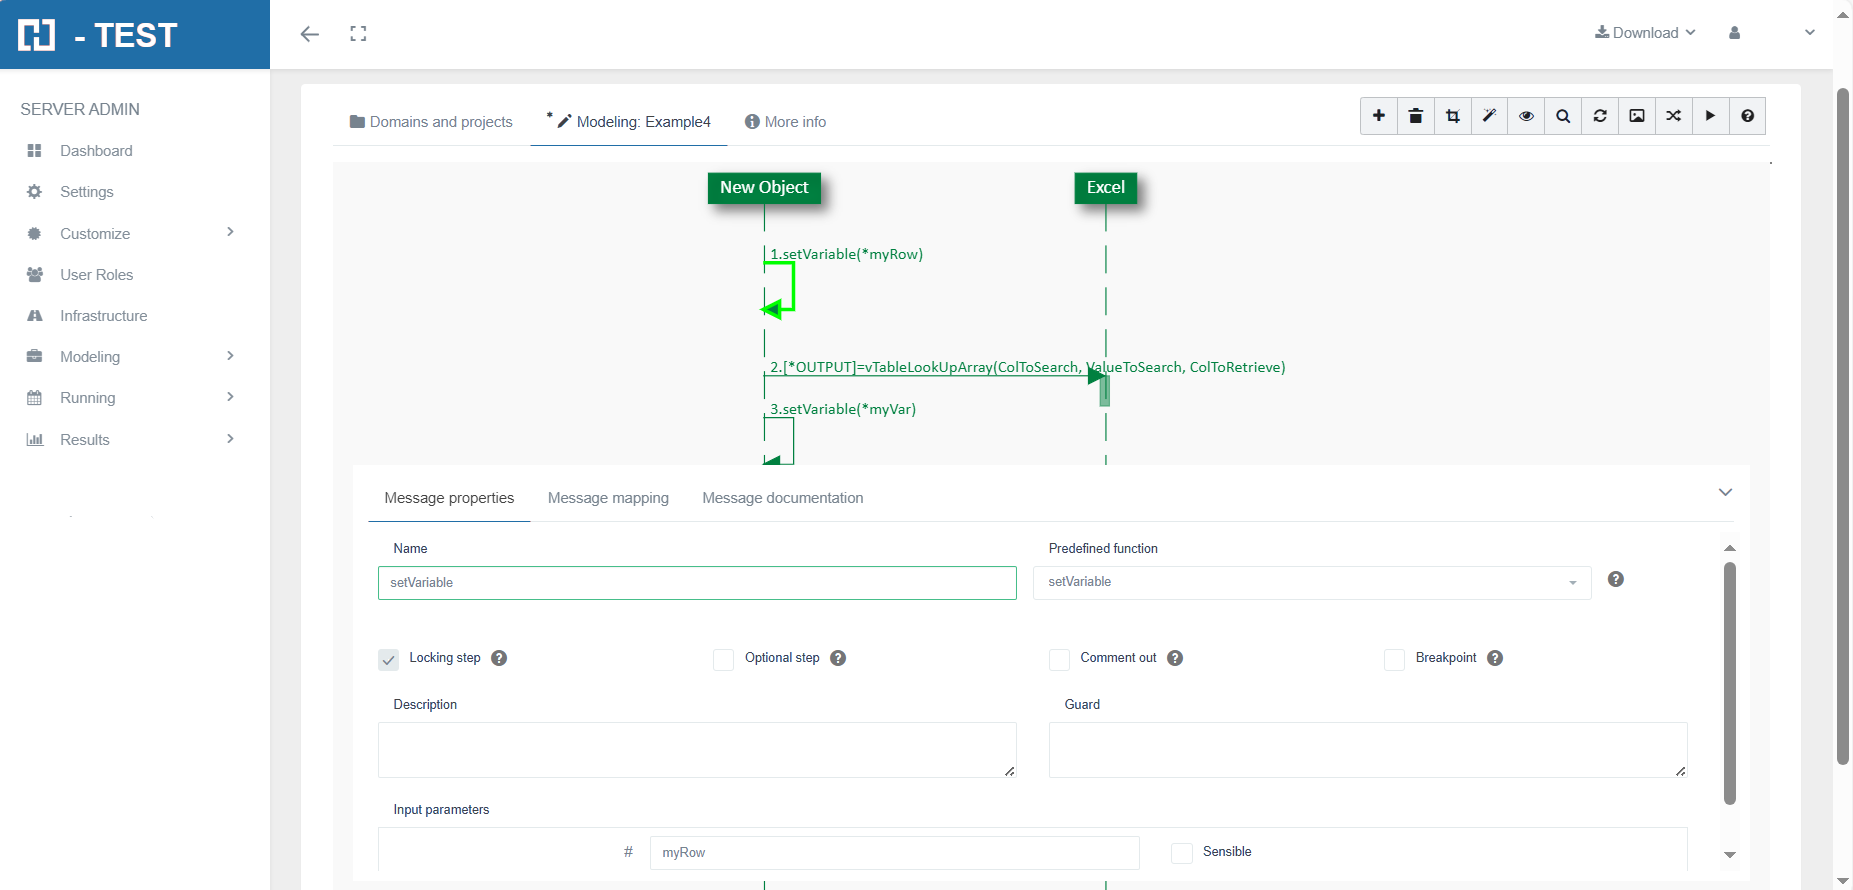
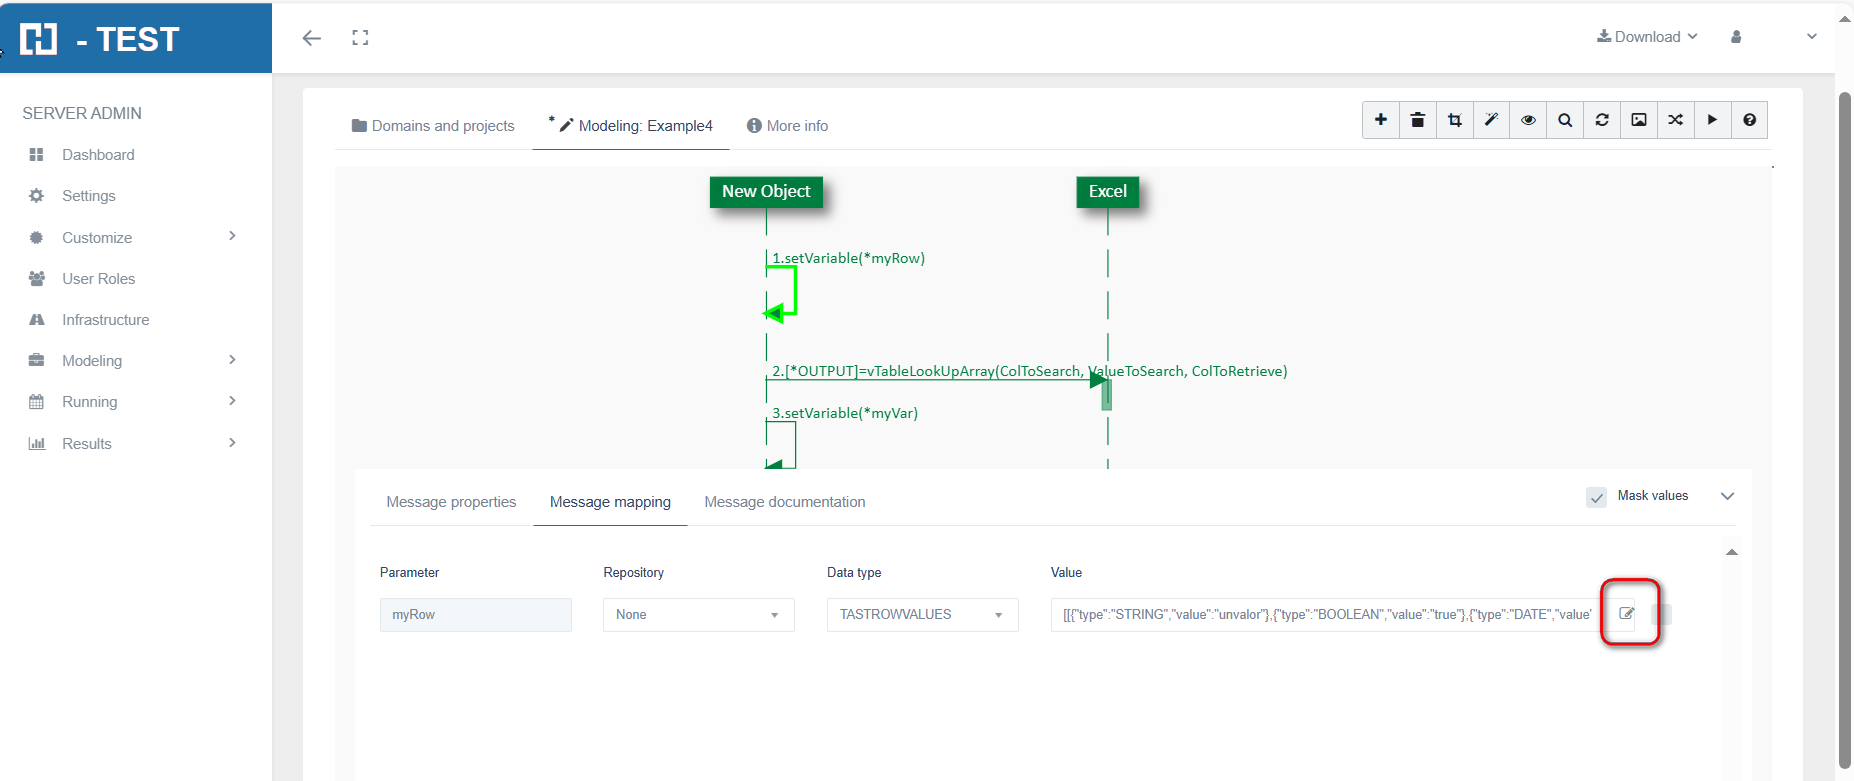
Let's take an example with two Adapters: User Adapter and Excel Adapter. In the User Adapter we are going to create a variable of this type. We use the Method or the Predefined Function SetVariable, for this we only have to choose the data type: TastRowValue and fill in.
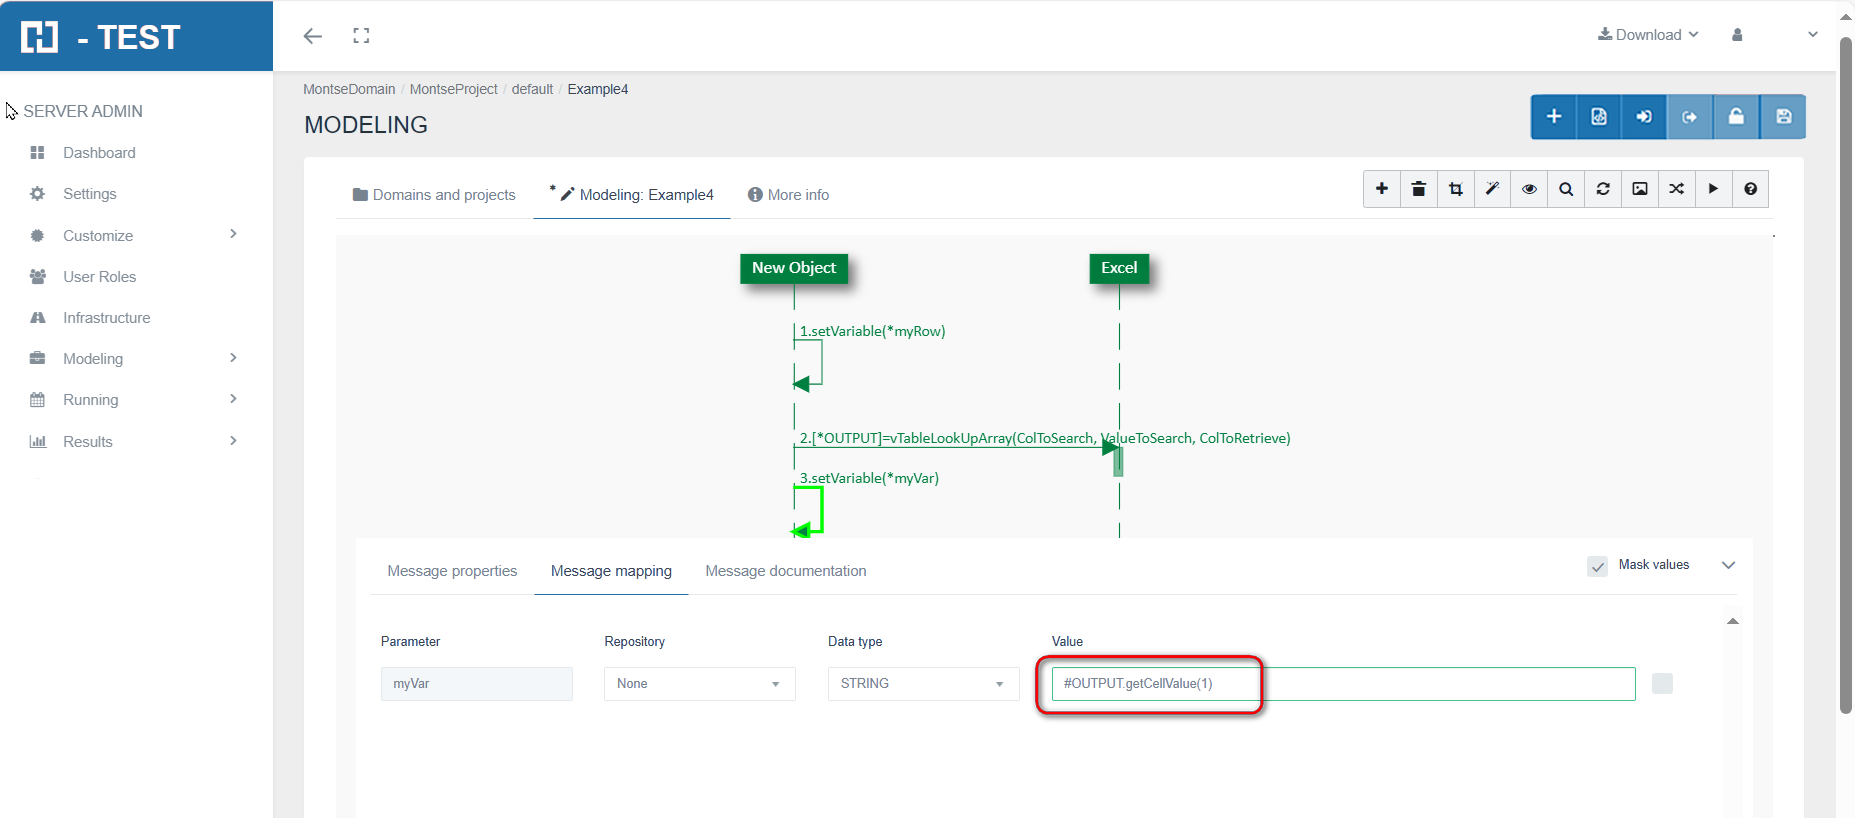
In this other example (message), the column whose row meets a condition is collected from an Excel file through the Excel Adapter. The result is stored in this data type, in the variable OUTPUT.
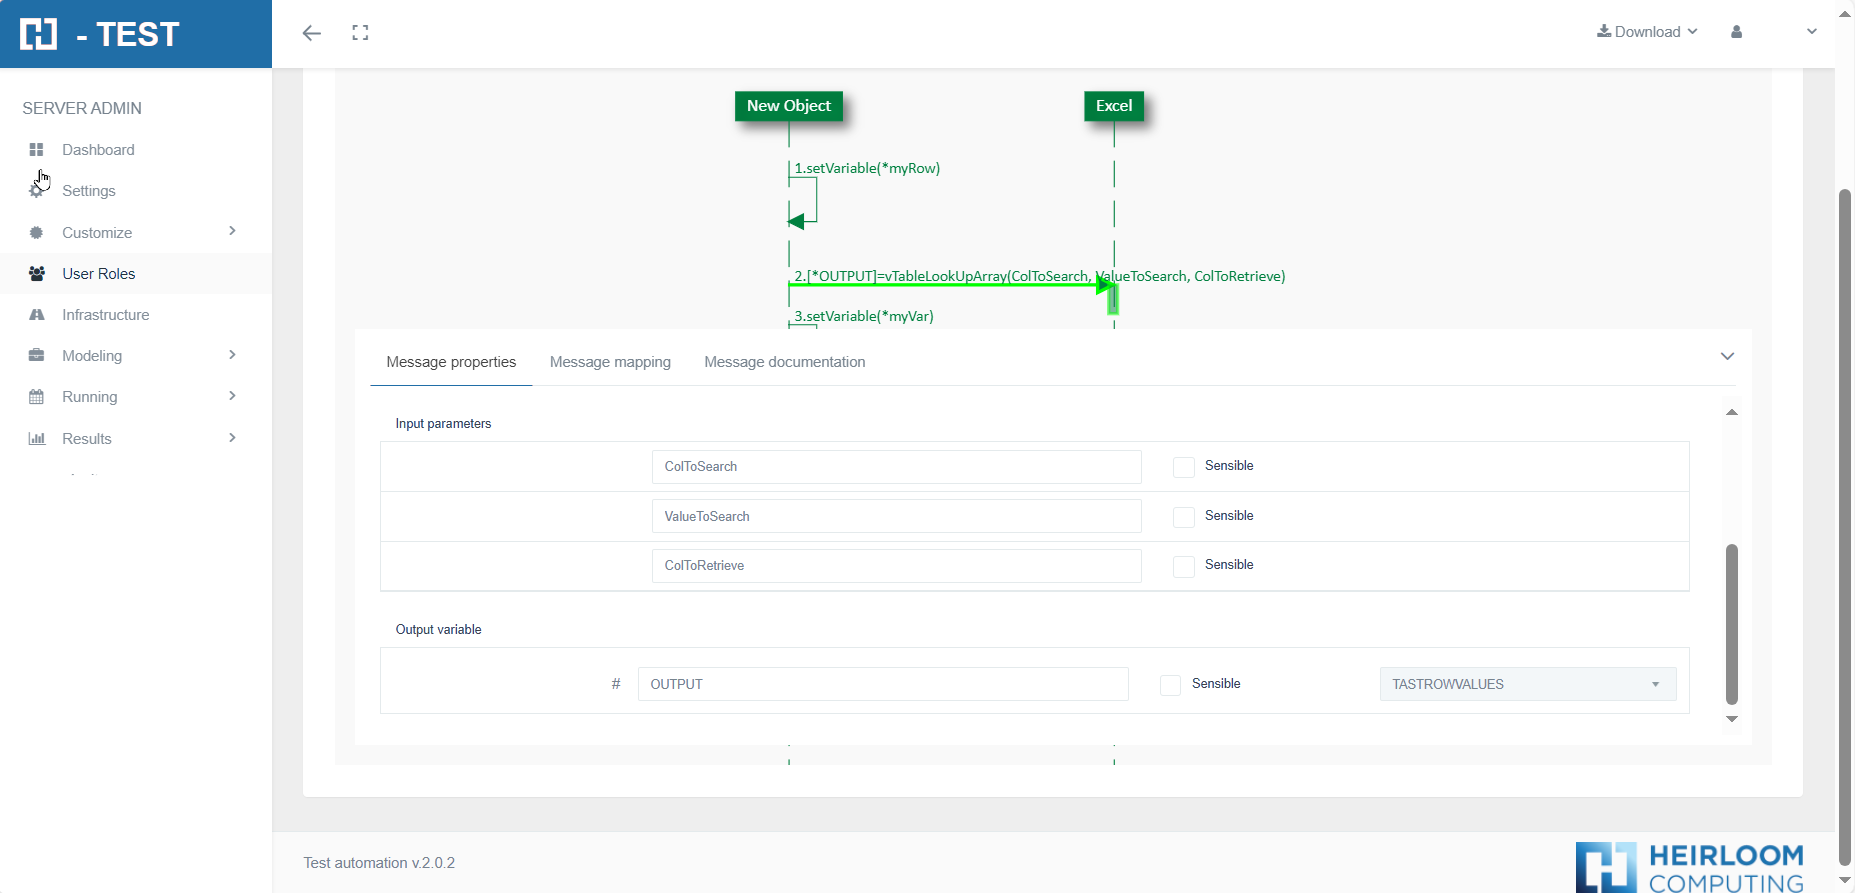
In this other example (message) we see that we are going to use the variable OUTPUT and we are going to obtain the index cell one, with these methods or Predefined Functions, the first cell is one, it is not zero.
For more information about Variables Management, see the topic Variables-Management-in-H-TEST.
The H-TEST Canvas
H-TEST has an important feature: the Canvas, which is a place where the user can paint the UML diagrams.
Actually, the Using H-TEST workflow starts from its Canvas.
Currently Canvas/Modeling does not work in Internet Explorer, because IE is a discontinued product. All other browsers Chrome, Edge and Firefox are supported. You can launch the Canvas from several places:
-
Creation of a new UML Diagram.
-
Editing an existing Diagram.
-
Navigation from several places of H-TEST to consult a diagram.
We have created a page where it is explained in detail, its use, the improvements made and all the features it has.
 H-TEST-Canvas
Data Management
With this option it will be possible to manage the data sets with which the tests corresponding to a specific diagram will be launched.
The Data Management option has three tabs:
-
Test Sets Data.
-
Test Set Data.
-
Test Sets Data Info.
Test Sets Data Window
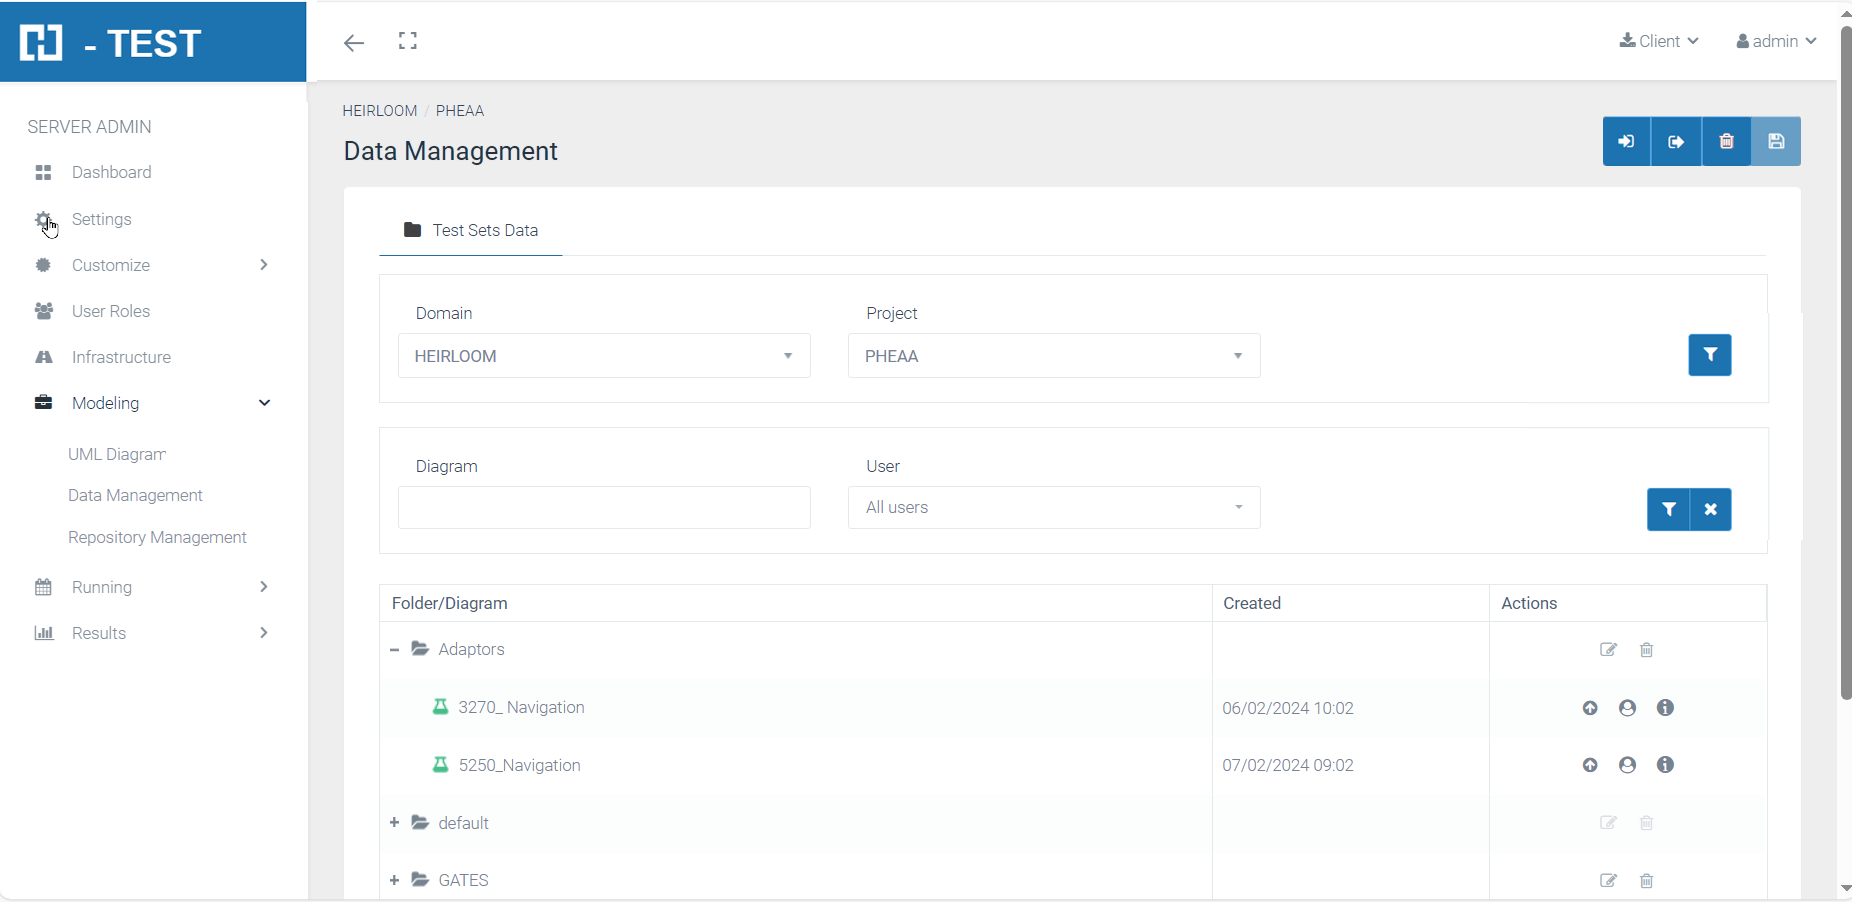
Displays the list of diagrams for a specific domain and project, with information about their test case data sets and test case sets. In general, we can filter by:
-
Domain.
-
Project.
-
Diagram.
-
User.
It will also allow you to modify and delete a folder.
In the main window of Data Management, the list of diagrams for the filters used will be displayed, with the following information:
-
Creation date.
-
Number of data sets of test cases.
-
Number of sets of test cases.
-
Action: with the following indicators:
-
Uploaded to ALM.
-
Owner.
-
More information: when you click on this option, the Test Set Data Info window appears.
-
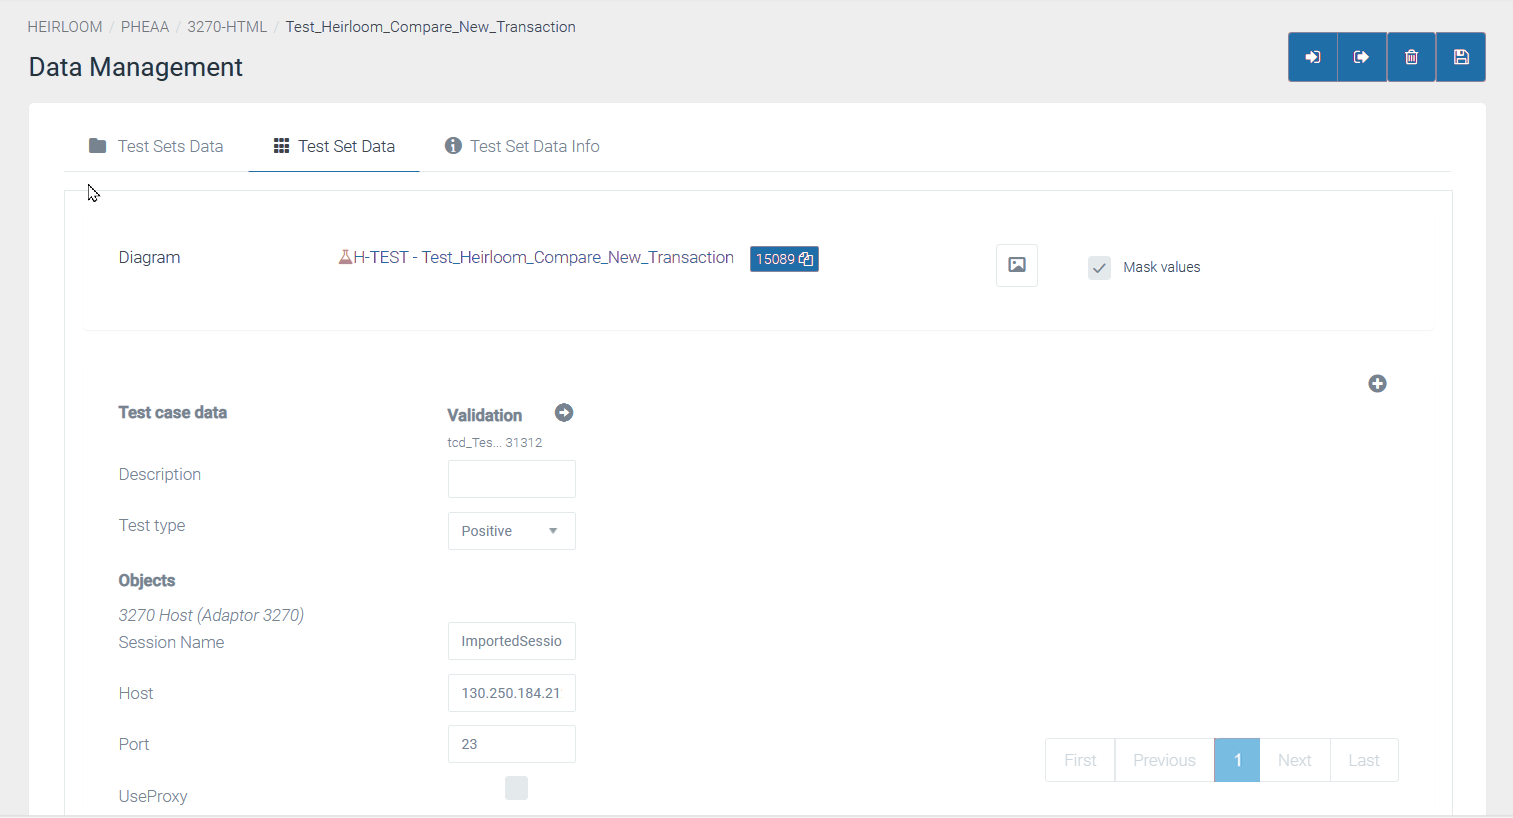
Test Set Data Window
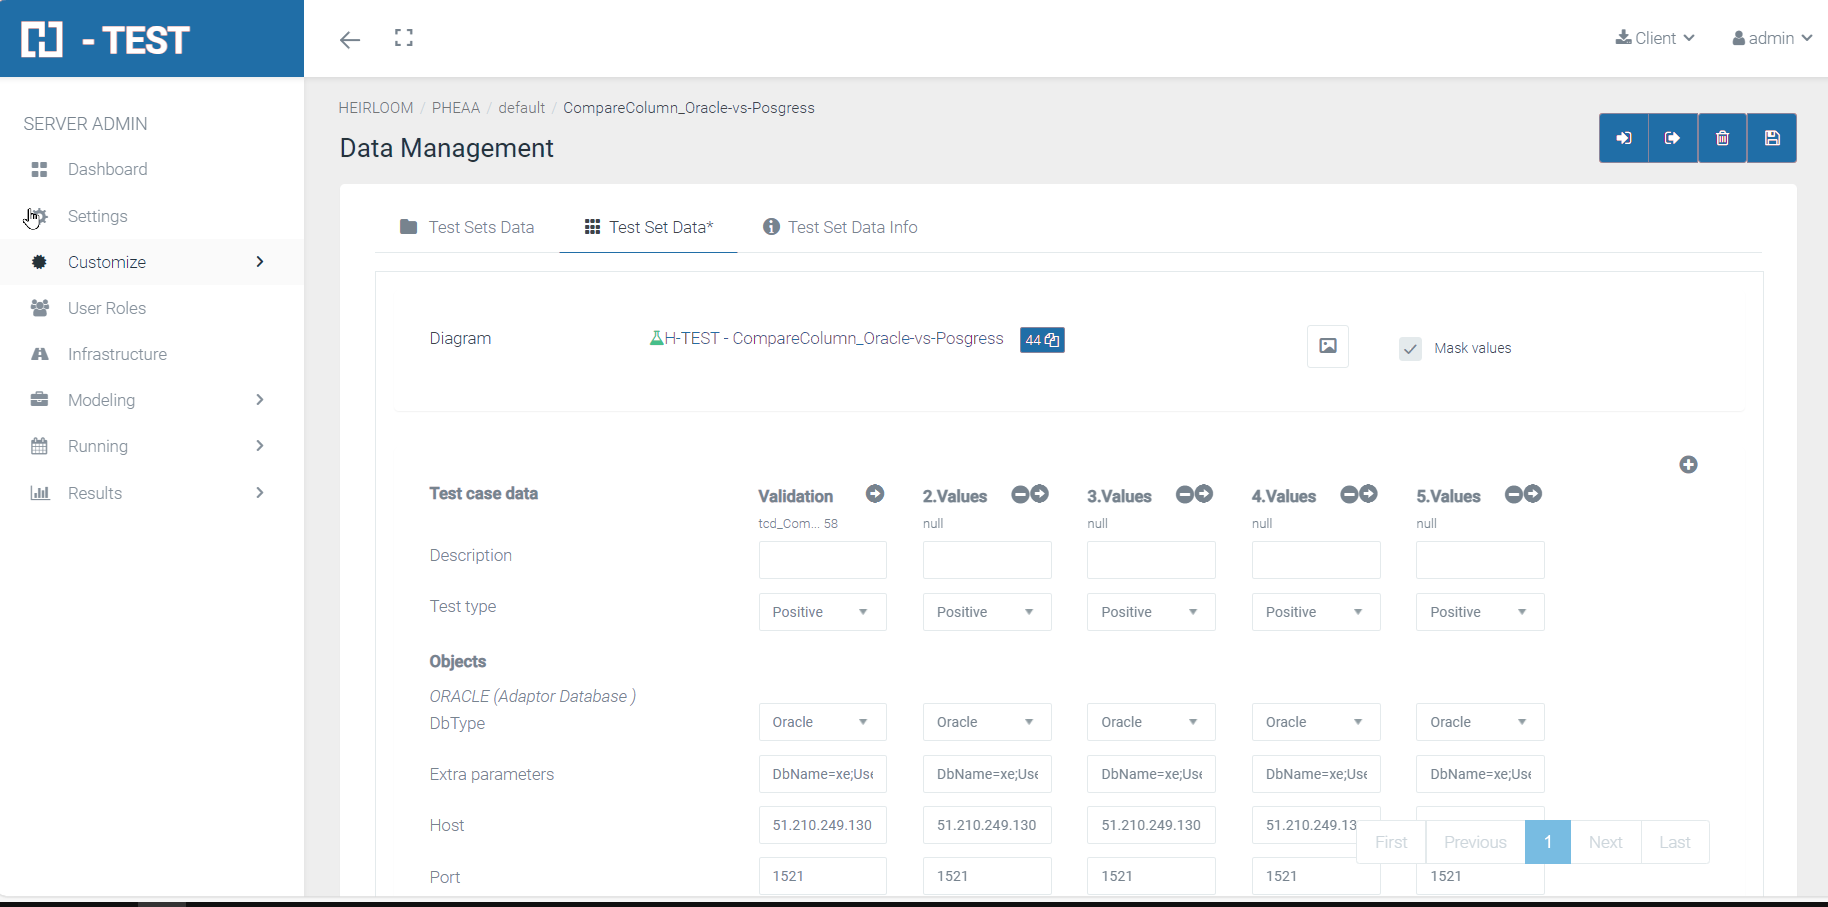
In this window the data of the test cases of a diagram will be created. Is accessed by clicking on any diagram of the Test Sets Data window.
There will be a set of validation data and 1 to n data sets of values. It will be possible to indicate:
-
The description of the Test case data.
-
The type of test (positive or negative).
-
The values for the parameters of the objects.
-
The values for the parameters of the messages.
You can also view the diagram.
There will be the option to copy the data of the test cases, which can be modified later.
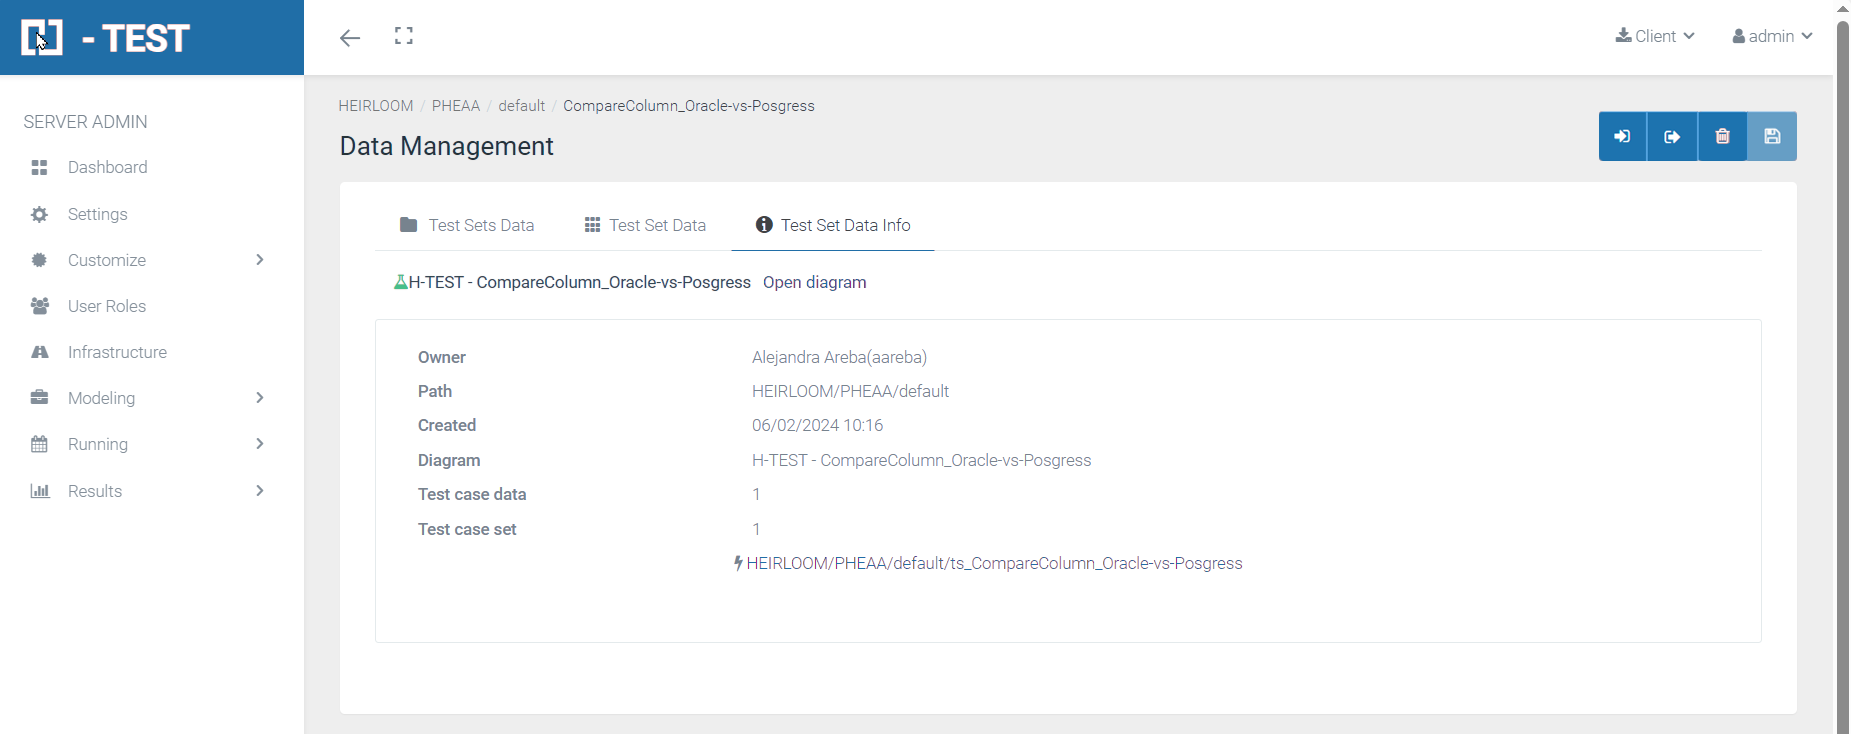
Test Set Data Info Window
There are two ways to access this Information Window:
-
Selecting the corresponding tab.
or
- Clicking on the icon More info of a diagram.
This new Information Window will provide us with information related to:
-
Owner user.
-
Diagram´s path.
-
Creation Date.
-
Name of the diagram.
-
Number of Test case Data.
-
Number of Test case Set and it´s path.
Delete Functionality
Back in the Test Set Data Window, we have another functionality to delete massively the Test Case Data (TCD) created for that Test Set (TS).
A new icon with a trash bin inside is located in the upper icon bar.
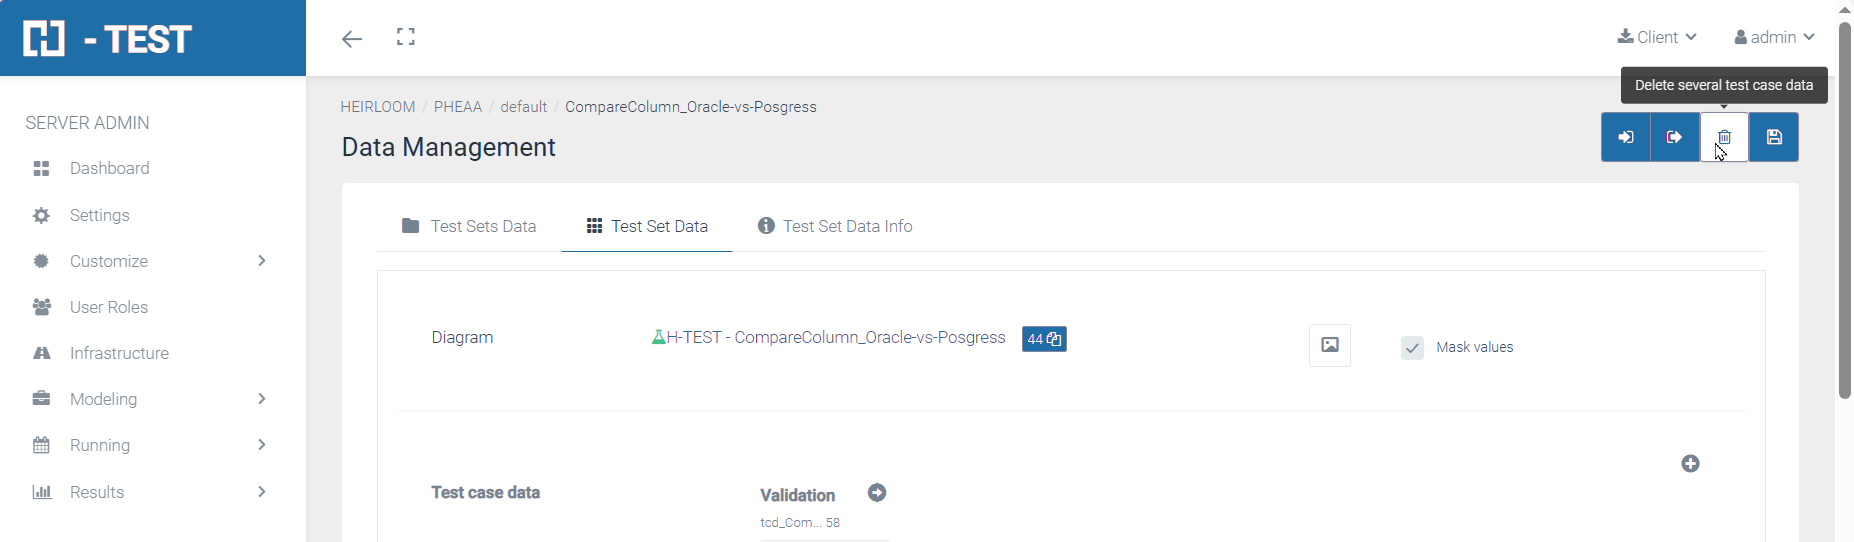
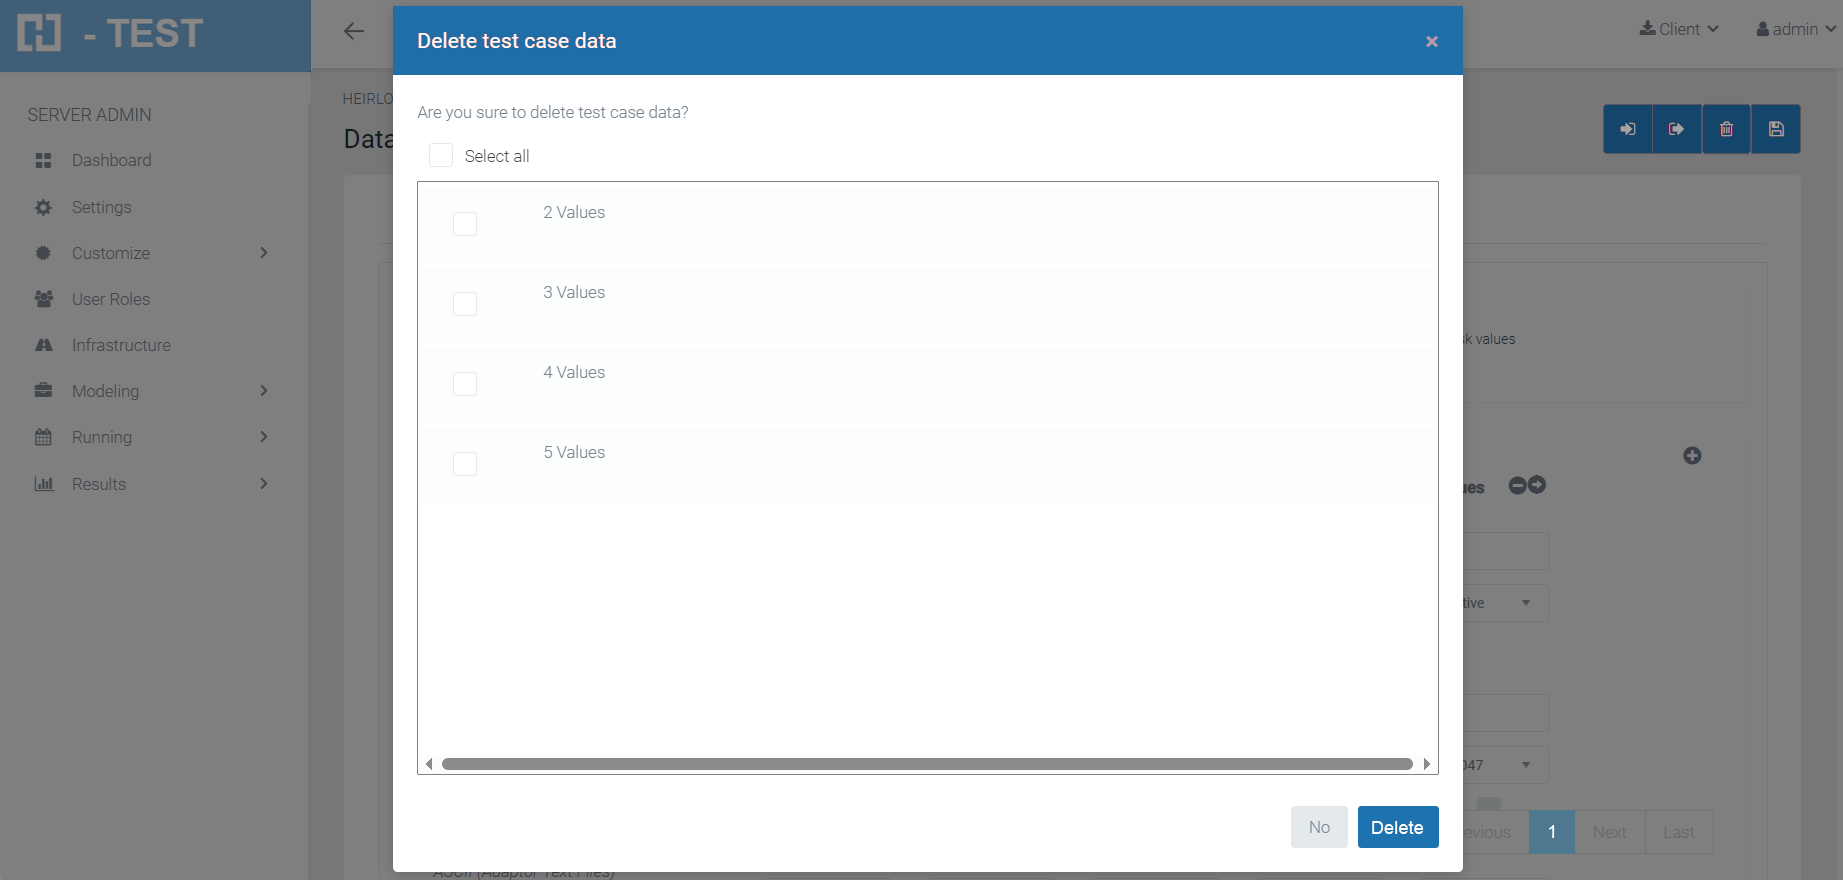
Different features in this modal window:
-
Every TCD have a checkbox.
-
Those checkboxes can be selected by clicking on them, and they will remain clicked instead you click them again.
-
Also, you can multiselect TCDs while holding shift and clicking two of them. (You can select segments that are separated each other, just selecting the first one without holding shift and then holding it).
-
There is a “select all” checkbox, that selects and deselects all the TCD.
-
To close the modal window without doing any changes, you can either click the cross in the top right or click in the “No” Button.
-
Finally, to delete all the selected TCD, click “Delete” button. It will close when the changes are done. If you want to save definitively the changes, you have to save the TS.
Import TCD from an Excel file
In this page you can also to import data from an Excel file. You just need to click in the Import icon to show the Import TC file page. Necesito 2 diagramas para explicar como se importa TCD desde un fichero Excel
Then,
-
You should provide an Excel file with the right order of data.
-
To set in the page, the correspondence between the column in the Excel file (A, B, etc.) with the related field Description, Test Type, etc.
After you select the file and set the correspondence, you should click the button Import to perform the import process.NECESITO IMAGEN
How to search an UML diagram in Modeling
This H-TEST option allows the user to do a search of a diagram (and its Test Case Data) among all the domains of the application. H-TEST also allows the filtering of Test Set in TS Management in all domains.
To use the search for a UML diagram, click on the filter button for all domains and projects.
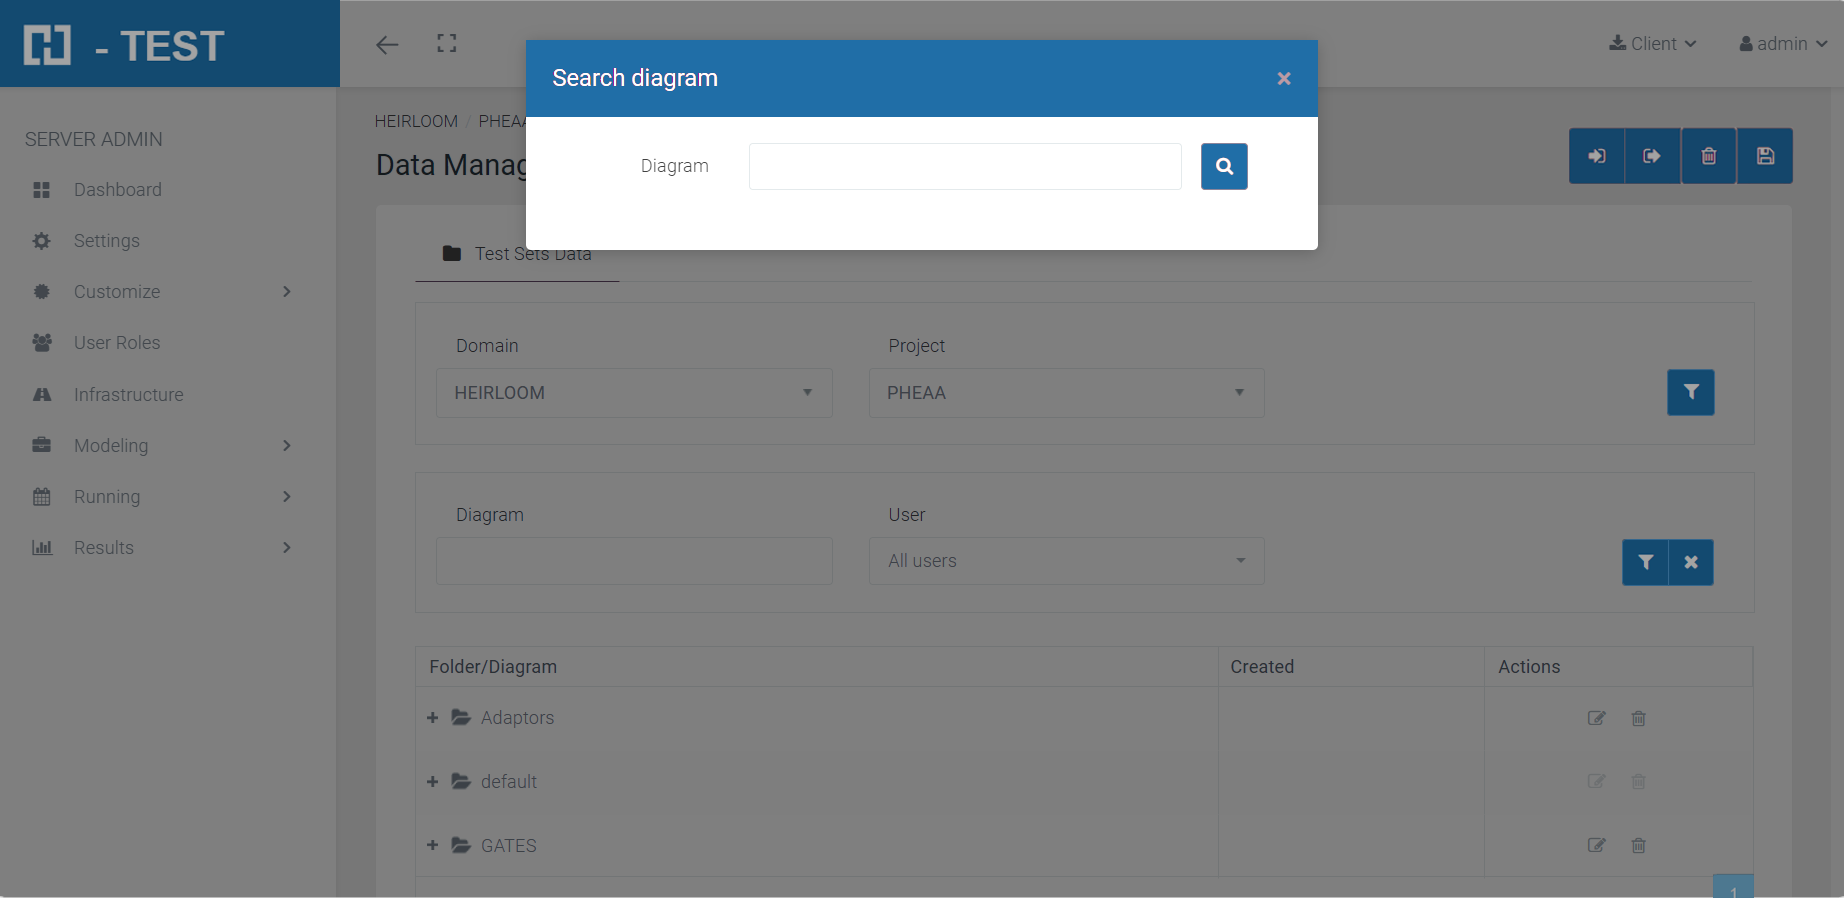
How to search an UML diagram in Data Management
This H-TEST option allows the user to do a search of a diagram (and its Test Case Data) among all the domains of the application. H-TEST also allows the filtering of Test Set in TS Management in all domains.
There are two types of searches:
-
by diagram ID.
-
by name (partial or total) of the diagram.
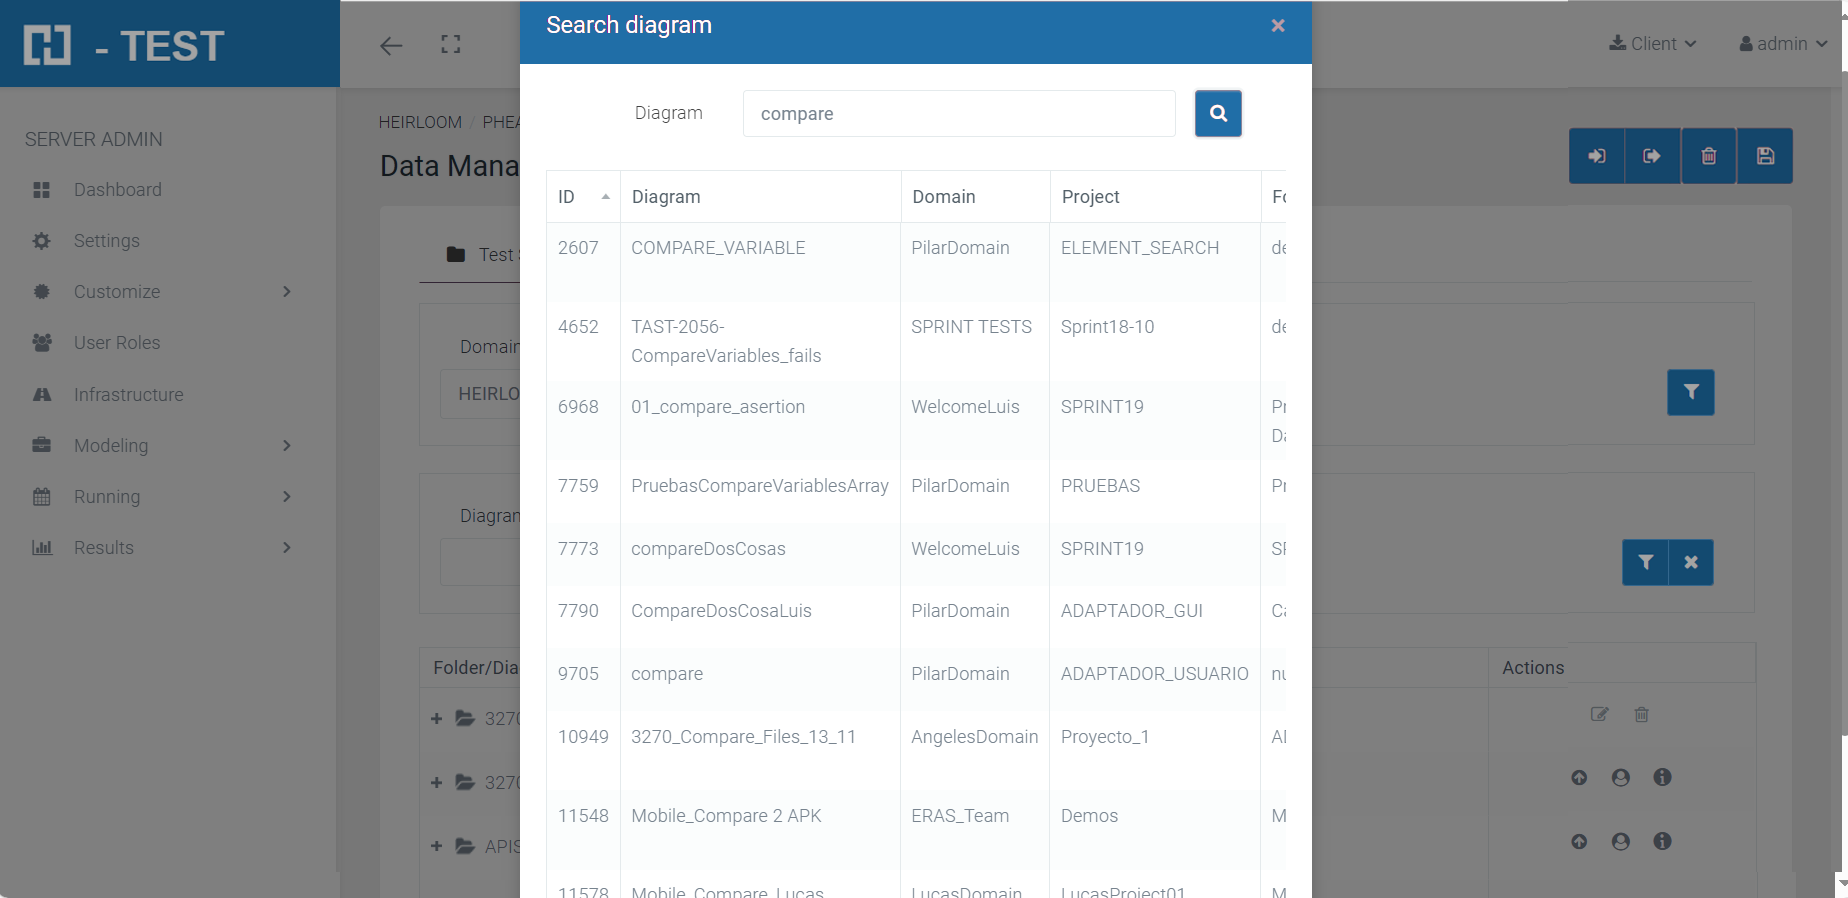
To use the search of an UML diagram in Data Management, follow these steps:
In Modeling, select the Data Management Option.
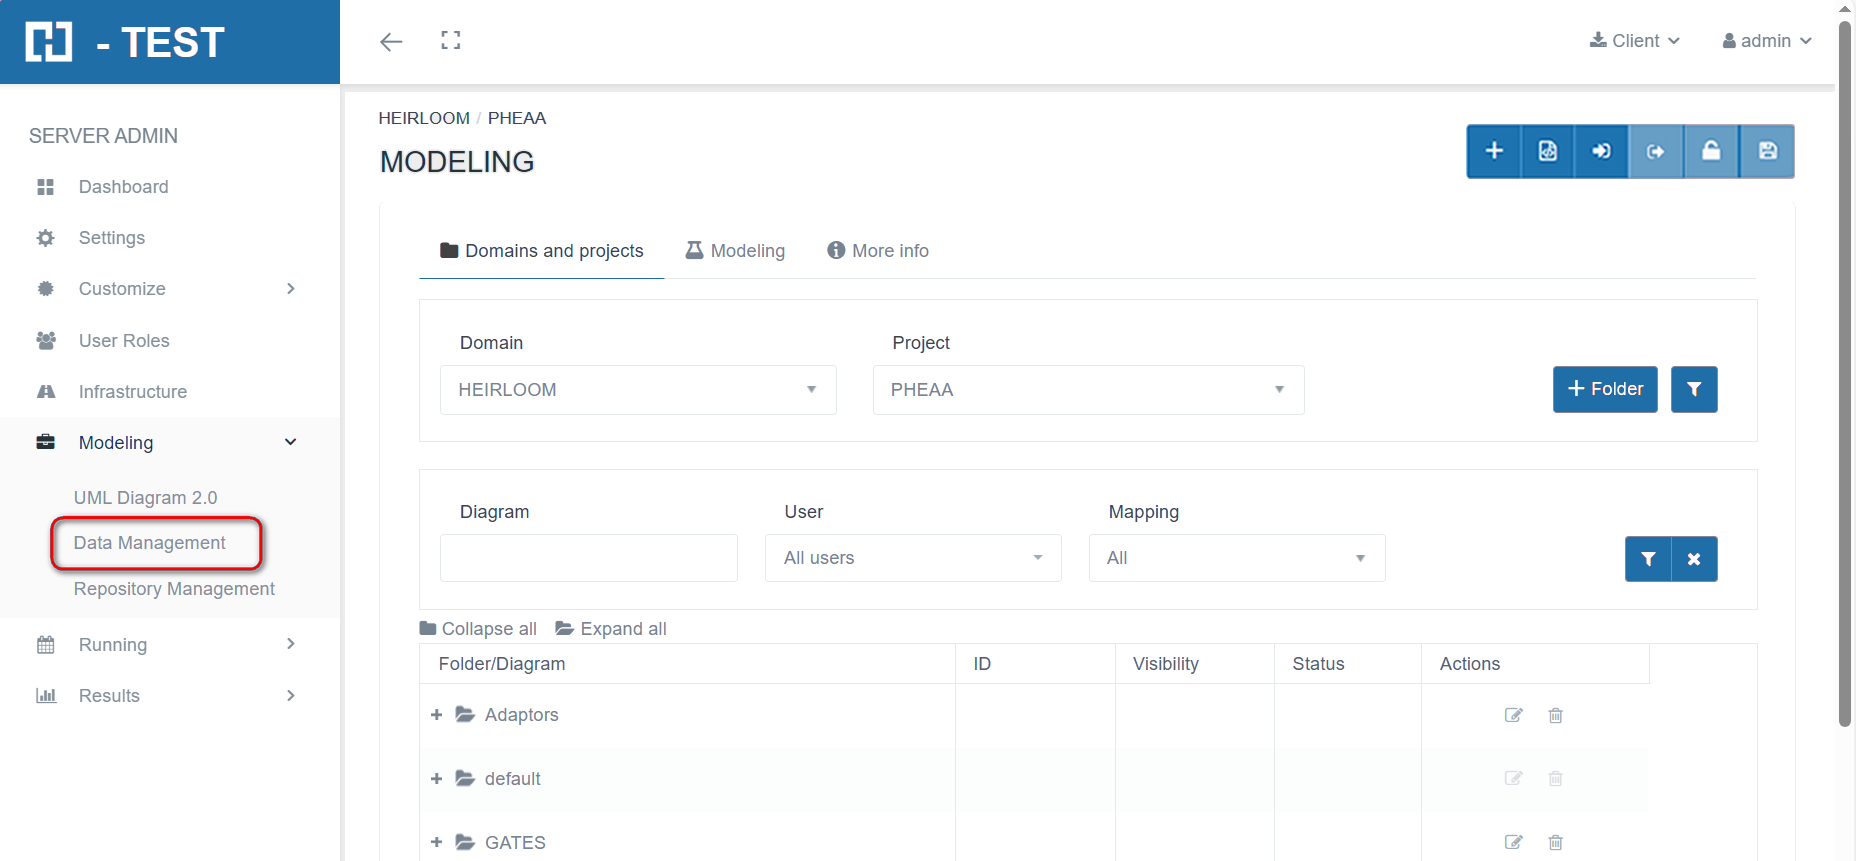
Click on the filter button of all domains and projects.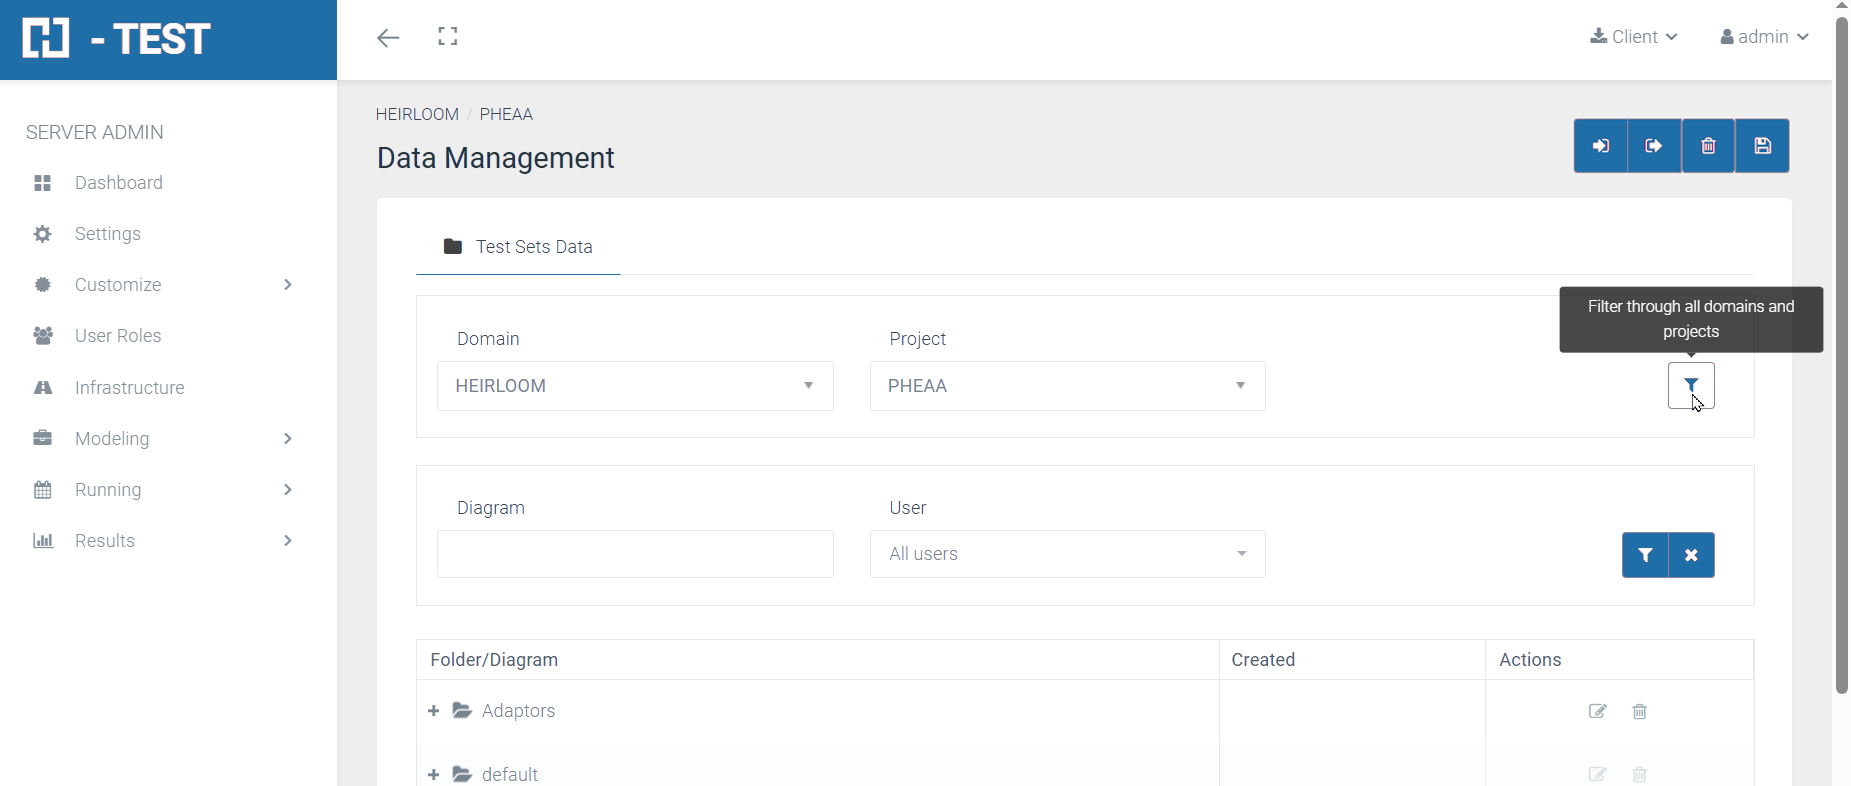
Search by diagram ID
In the search field you type the diagram ID of the search you want to perform, and click on the magnifying glass button. The application shows the Test Set Data corresponding to the diagram with the specified ID in the search.
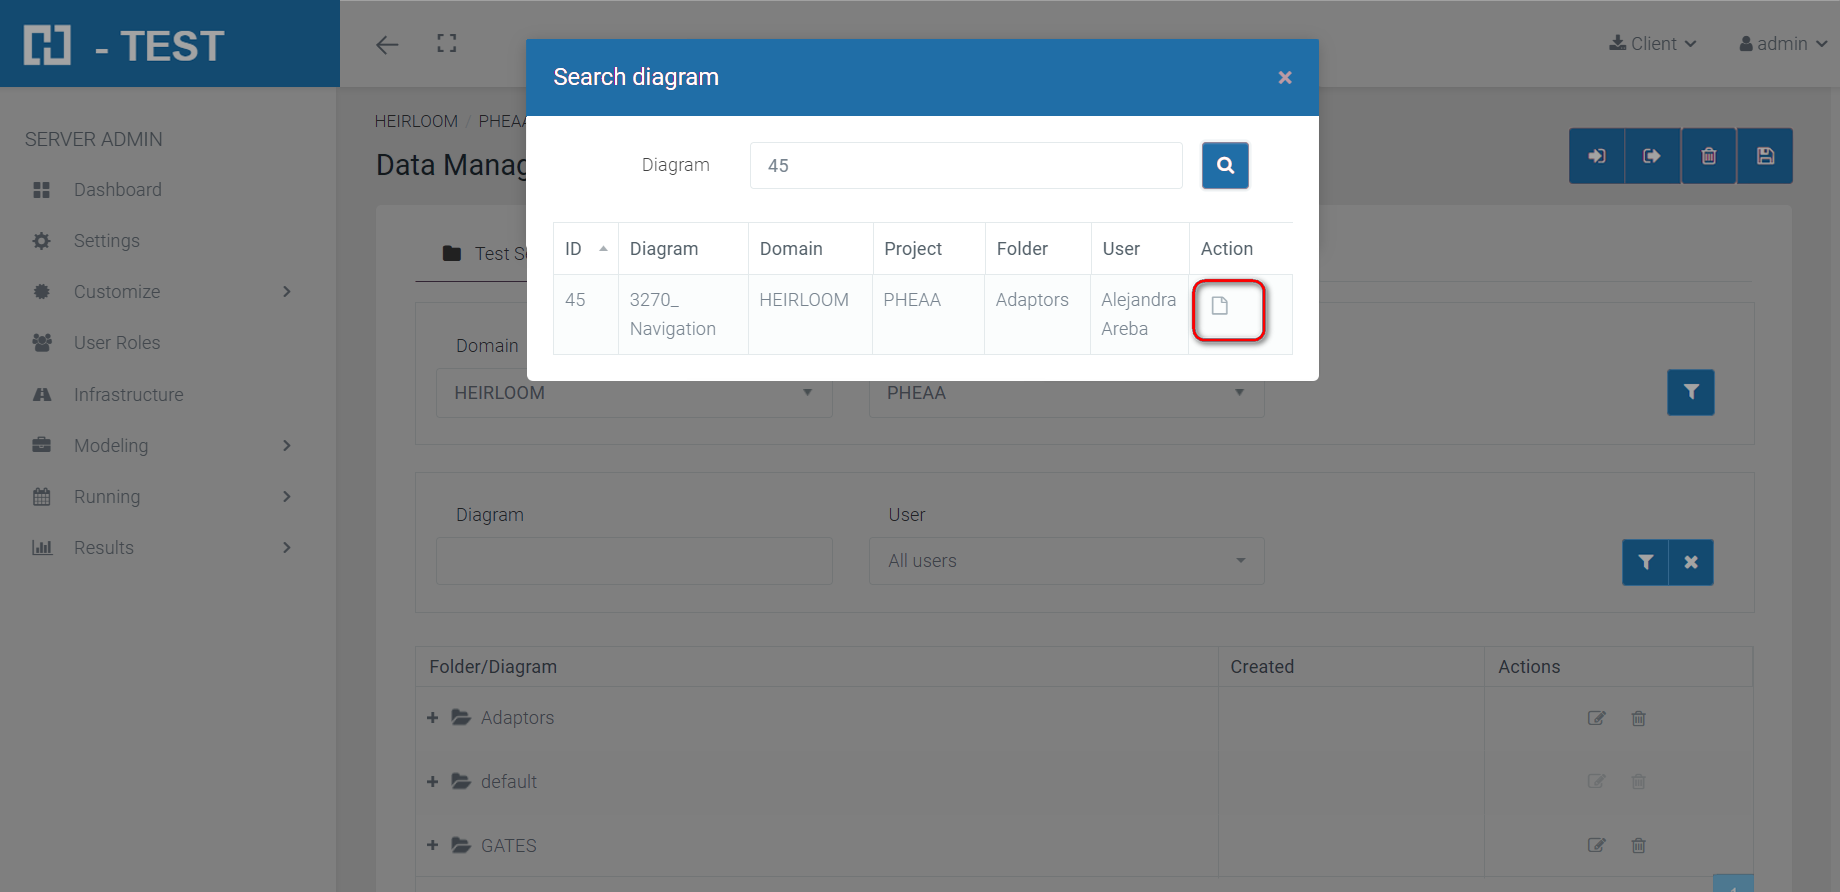
If you click on the file icon, the Test Set Data will open directly: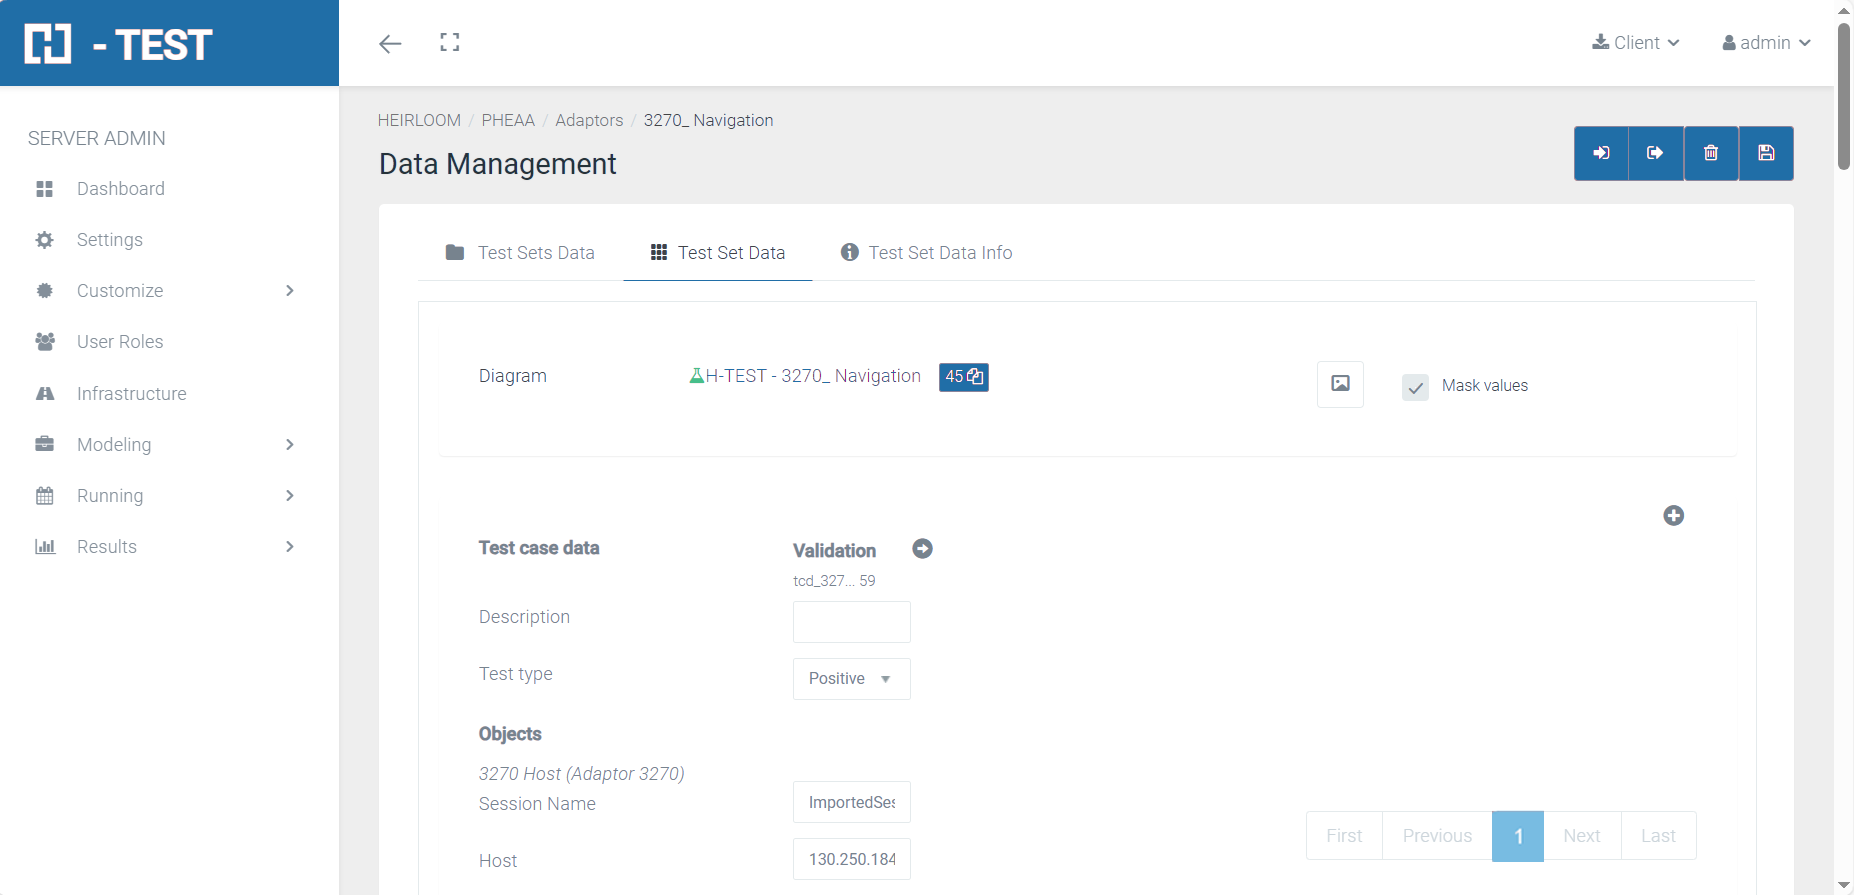
Search by diagram name
In the search field you type the characters of the search you want to perform, and click on the magnifying glass button.
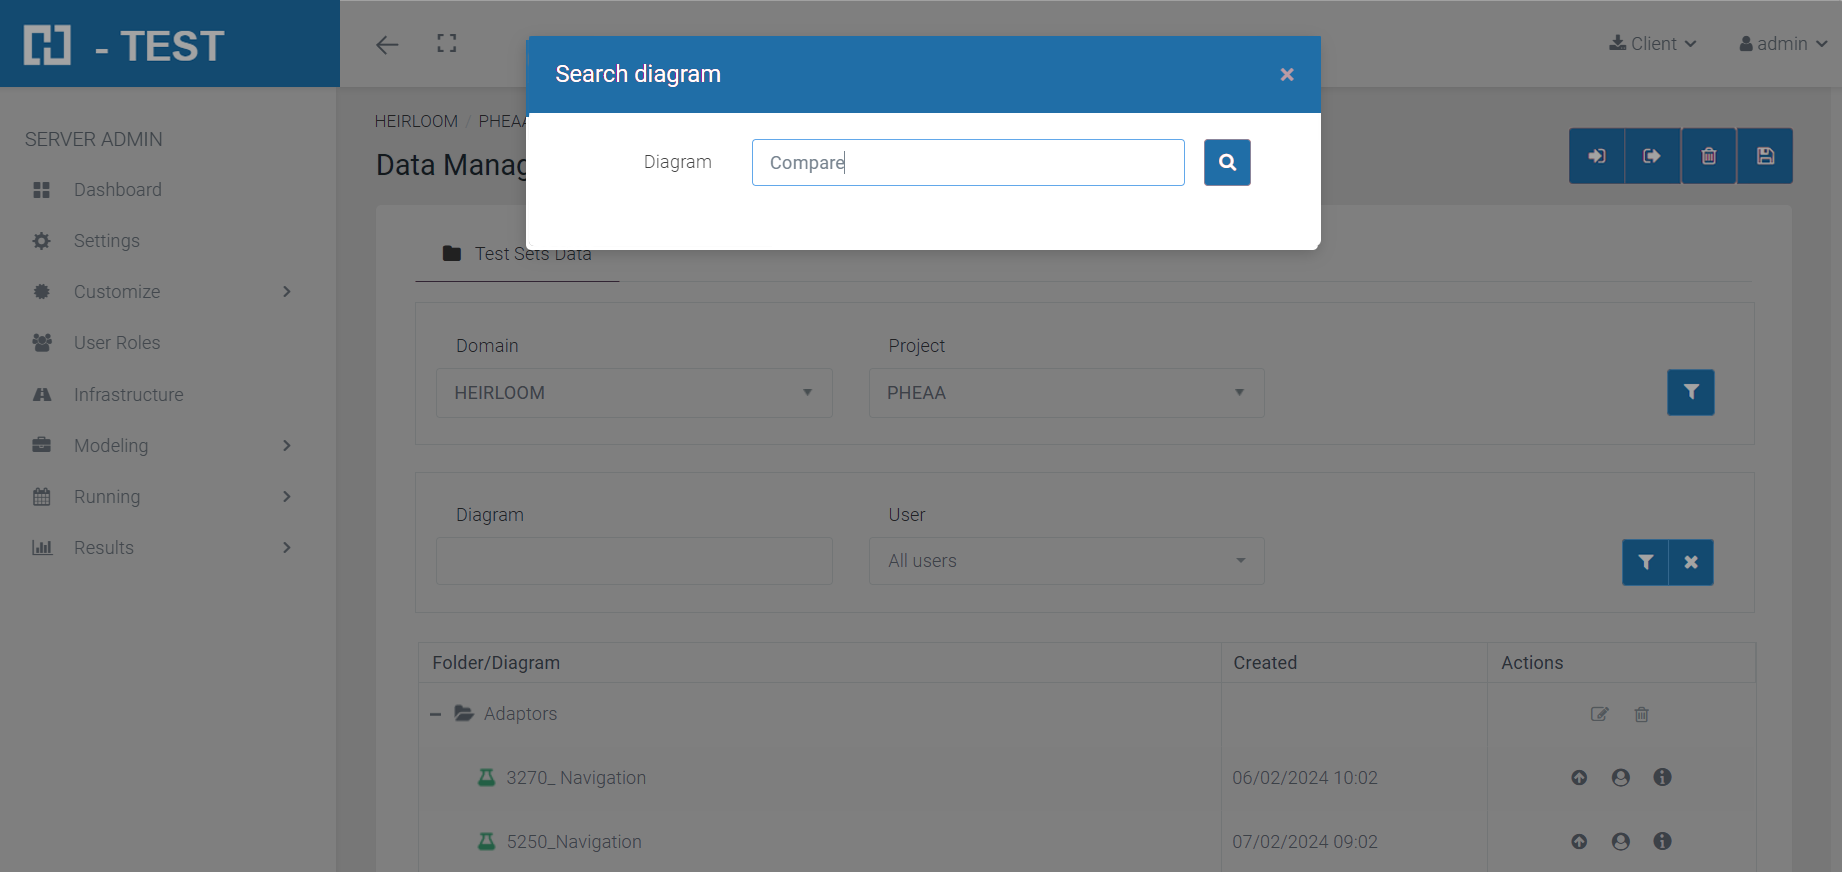
The application shows all the diagrams of all the domains that contain the characters entered in the search.
If you click on the list icon, the application will switch to the selected Test Case Data, Domain and Project:
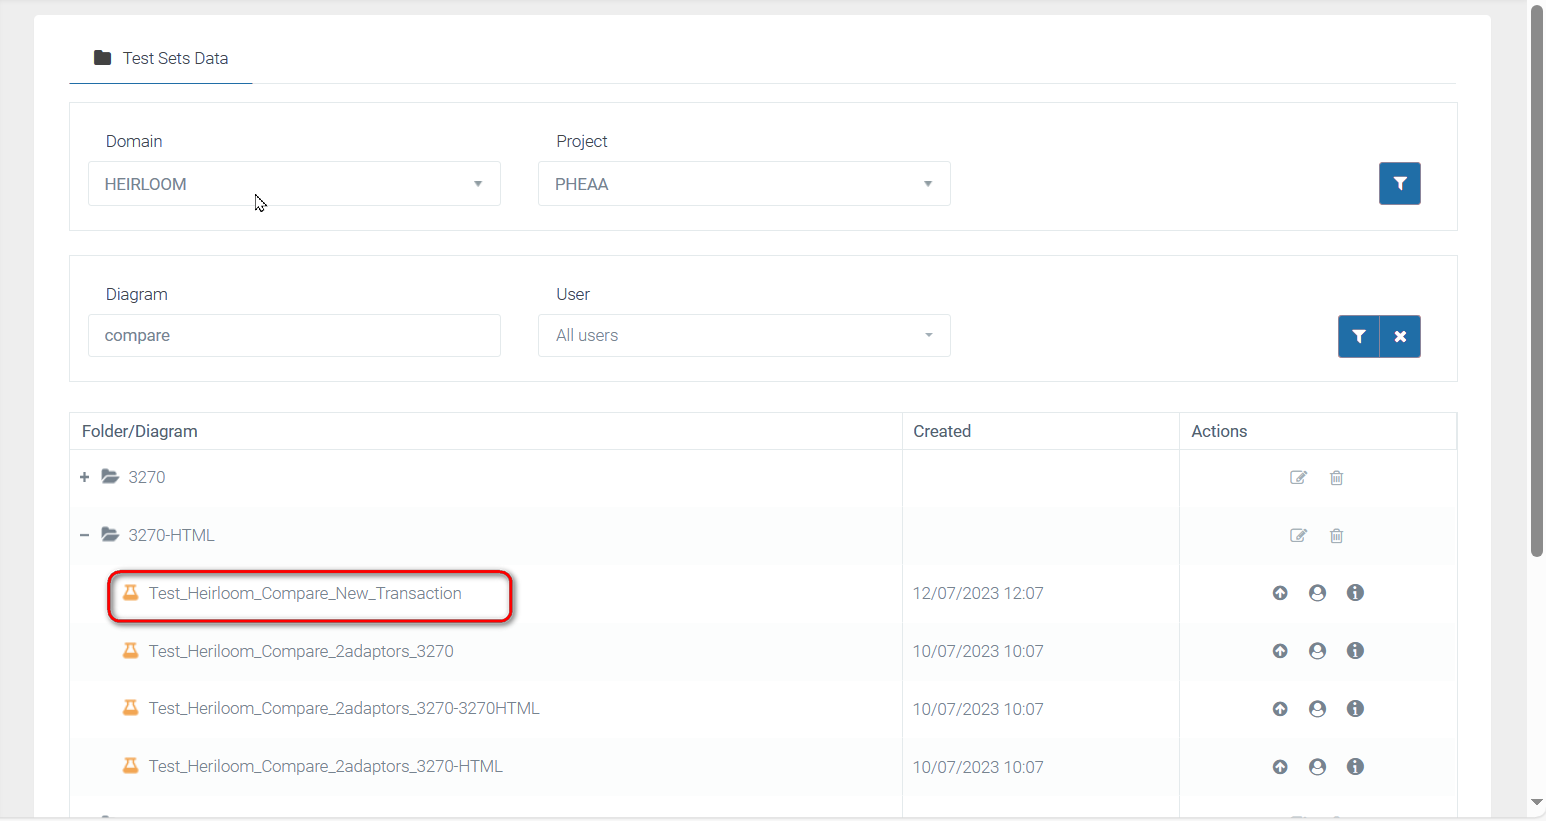
Clicking on the diagram, you can see the Test Case Data of the selected diagram.
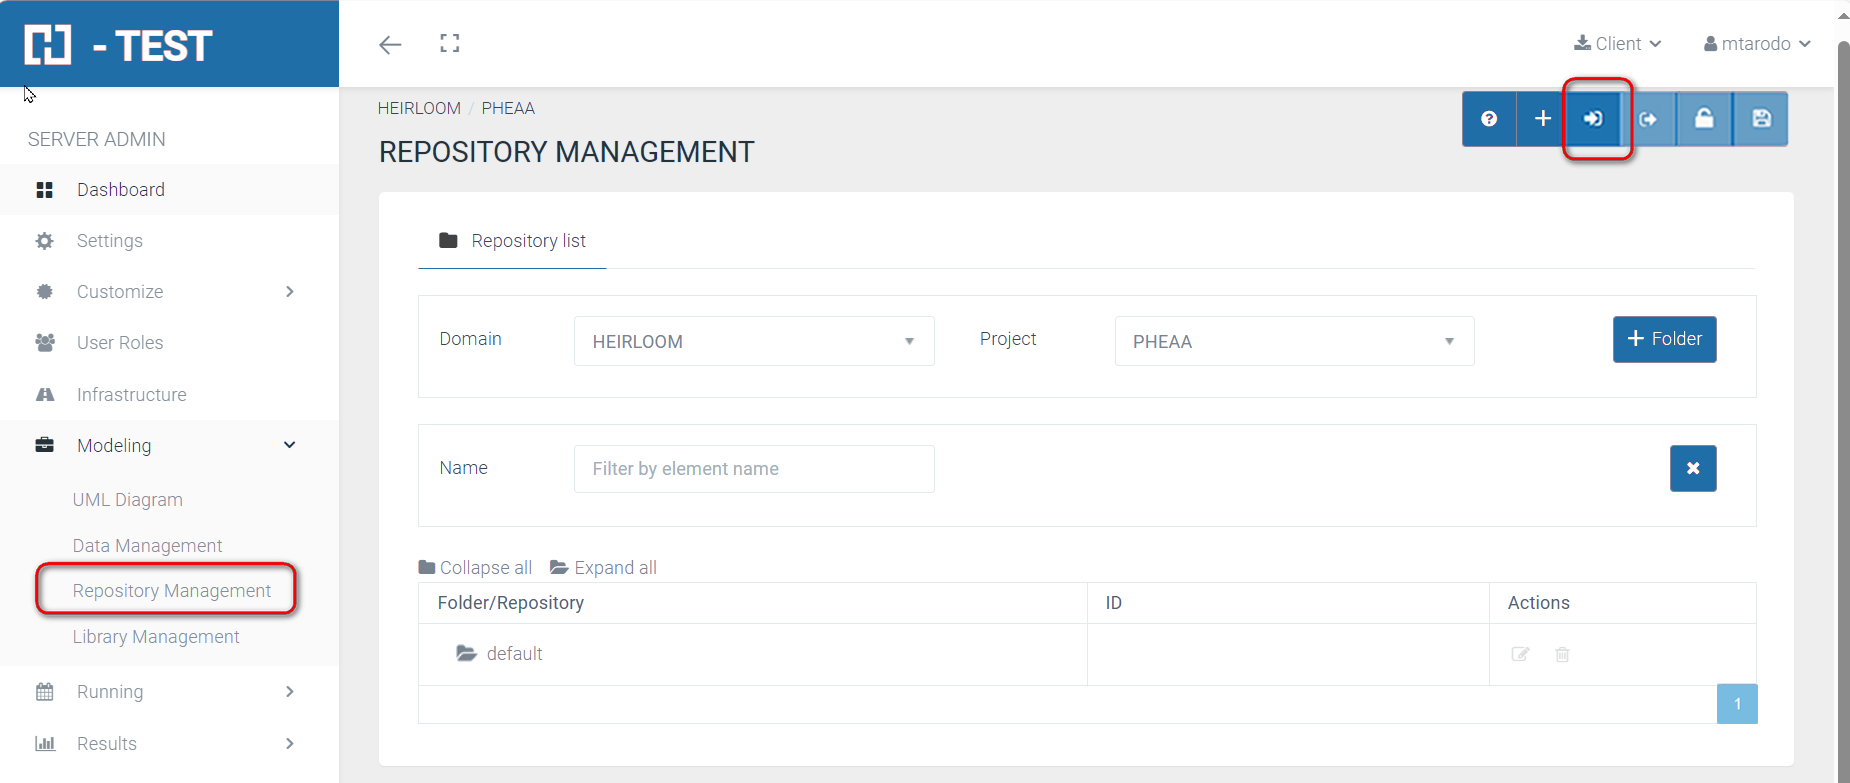
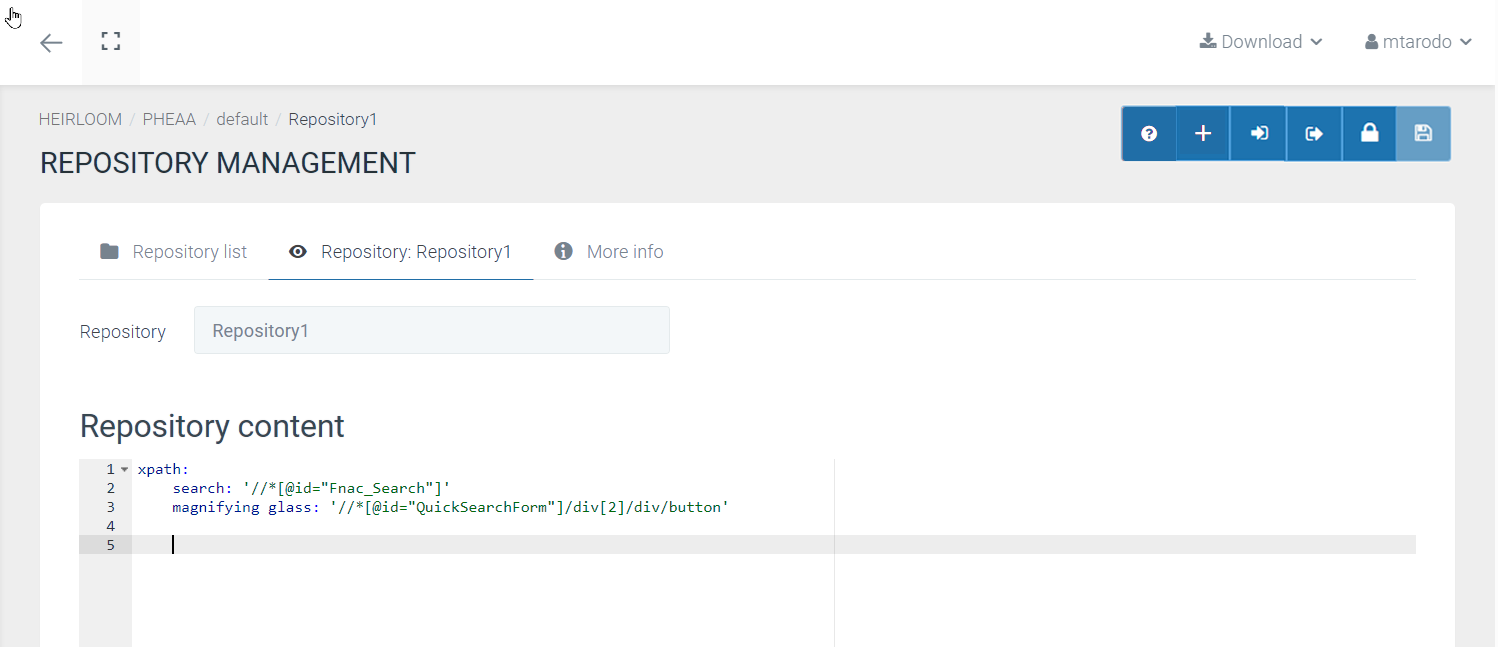
Repository Management
In this tab, all the repositories that the users are going to use in the diagrams will be stored The repositories are TXT or YML files (they must have YML /YAML format) that we create and upload to this tab and contains information that we can use in a diagram.
Glosary
To evade confusions with the functionality, and to briefly explain how to create repositories we have to know the details about the elements used here. Next we have a detailed example.
Concepts to create a repository:
-
Files: they can be Text files or YML/YAML there the user insert the code to use the repository. Mention that if we don’t have an environment (like Notepad++ or others) with transformation between tab spacing or normal spaces. The file won’t work if you use the tab for spacing instead normal spaces because the indentation with tabs don’t work in YML.
-
Keys: They are every word that comes before “ : ”
-
Value: Value is what comes after “ : ”
-
Properties: Is the entire path that includes the keys until the “ : ” using “ _ ” to separate them.
Example:
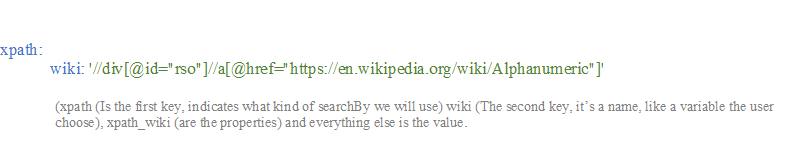
Also, you can do subkeys: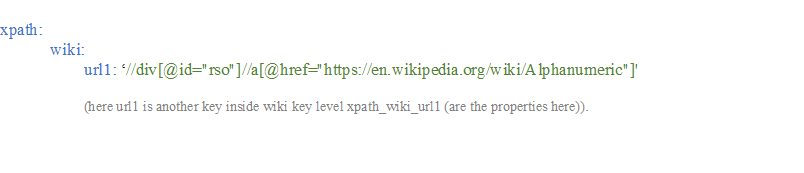 So in the end, the variable will have all the properties separated by “_” in this example should be: #wiki_url1.
The first key will always be one of the following words:
Features
In the repository management we have different “features”:
-
Import repositories with a TXT and YML extension. The repositories are defined by keys. These repositories must have a first level key that will be a “searchBy” option listed in a diagram message. Then it will have a second key that will be a name to identify the property and finally the value that is the path of the searchBy we are using. (those keys are not “case sensitive”, nevertheless, when you put it in the element box in the message, it has to be exactly as the repository property.
Example:

-
Export repositories as YML files saved in repository management.
-
Open, edit, delete, and save repositories.
-
Create, edit and delete the folders in which those repositories will be kept. A folder with a repository saved in, can´t be deleted. You have to delete the repository before. (default folder can´t be deleted)
-
Clone a repository already imported into a new one.
-
Watch information about repositories such as creation date and diagrams that use it, works like more information tab in modeling.
-
Locate where a repository is being used.
Import repositories
In the repository management tab, we have to click the import button in the top right side.
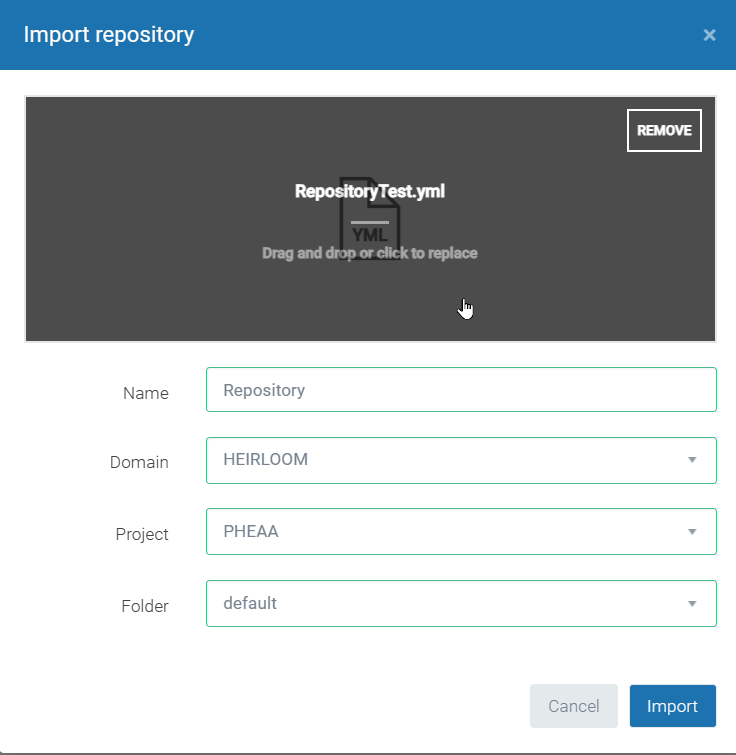
Then a modal window will appear.
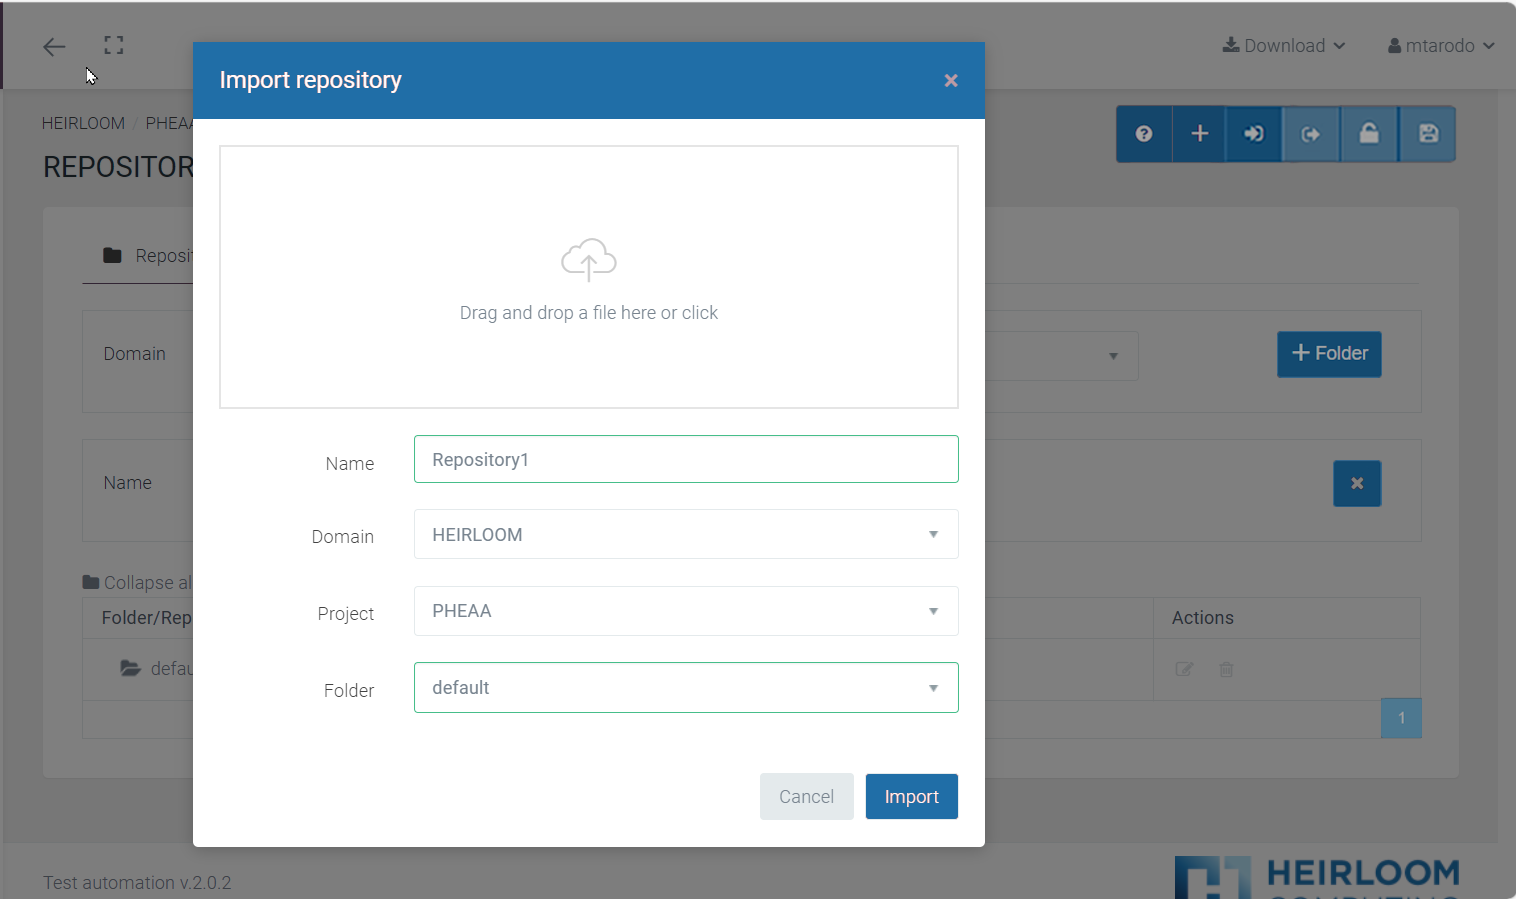
In this modal window, we choose the name of the repository, domain and project also the name and where to save it.
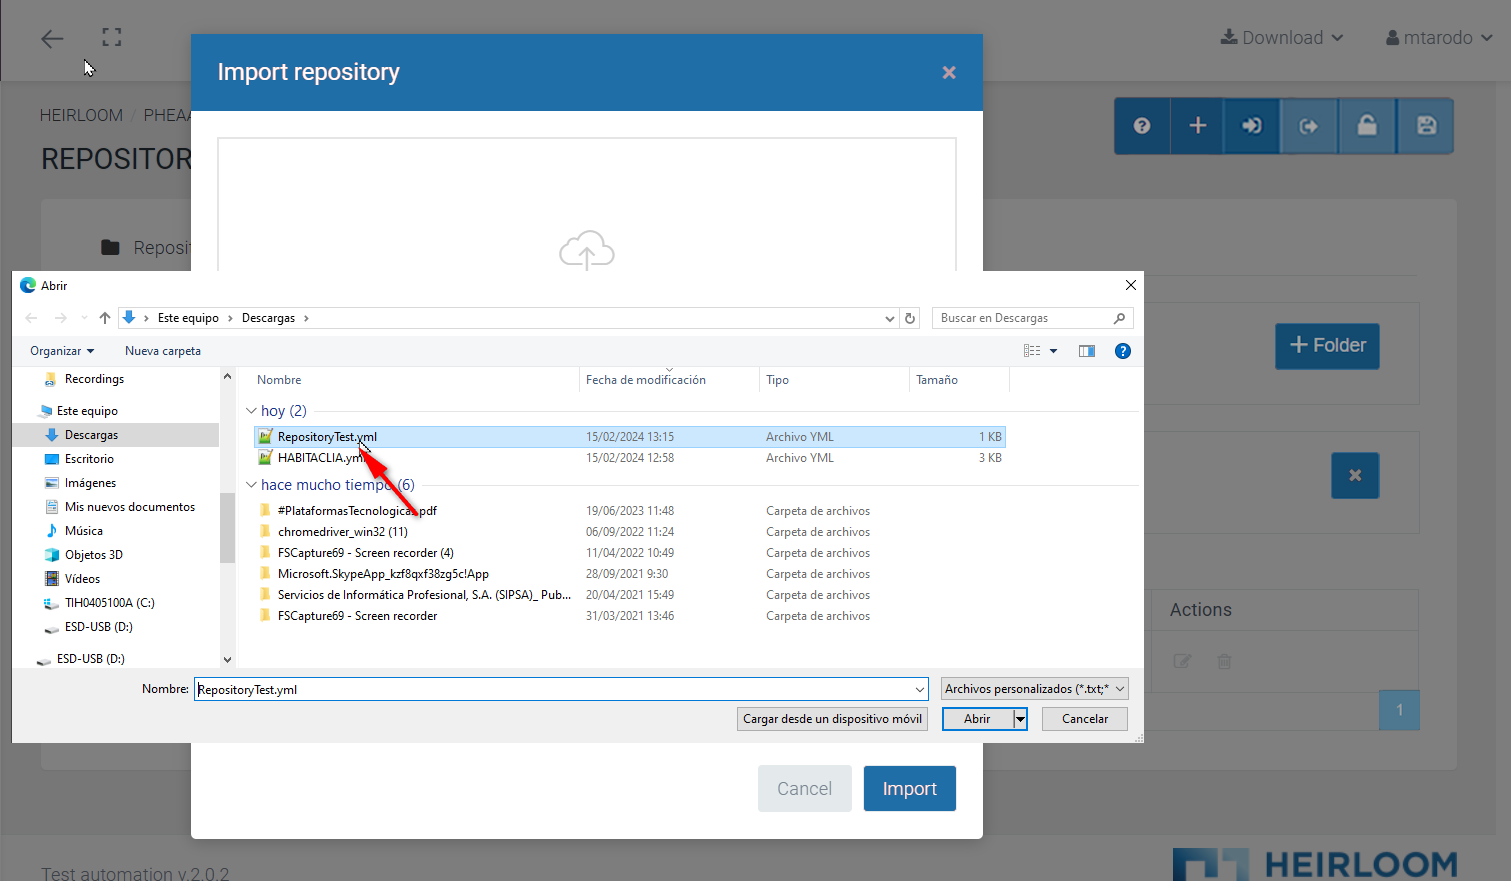
Once it is ready, we click import.
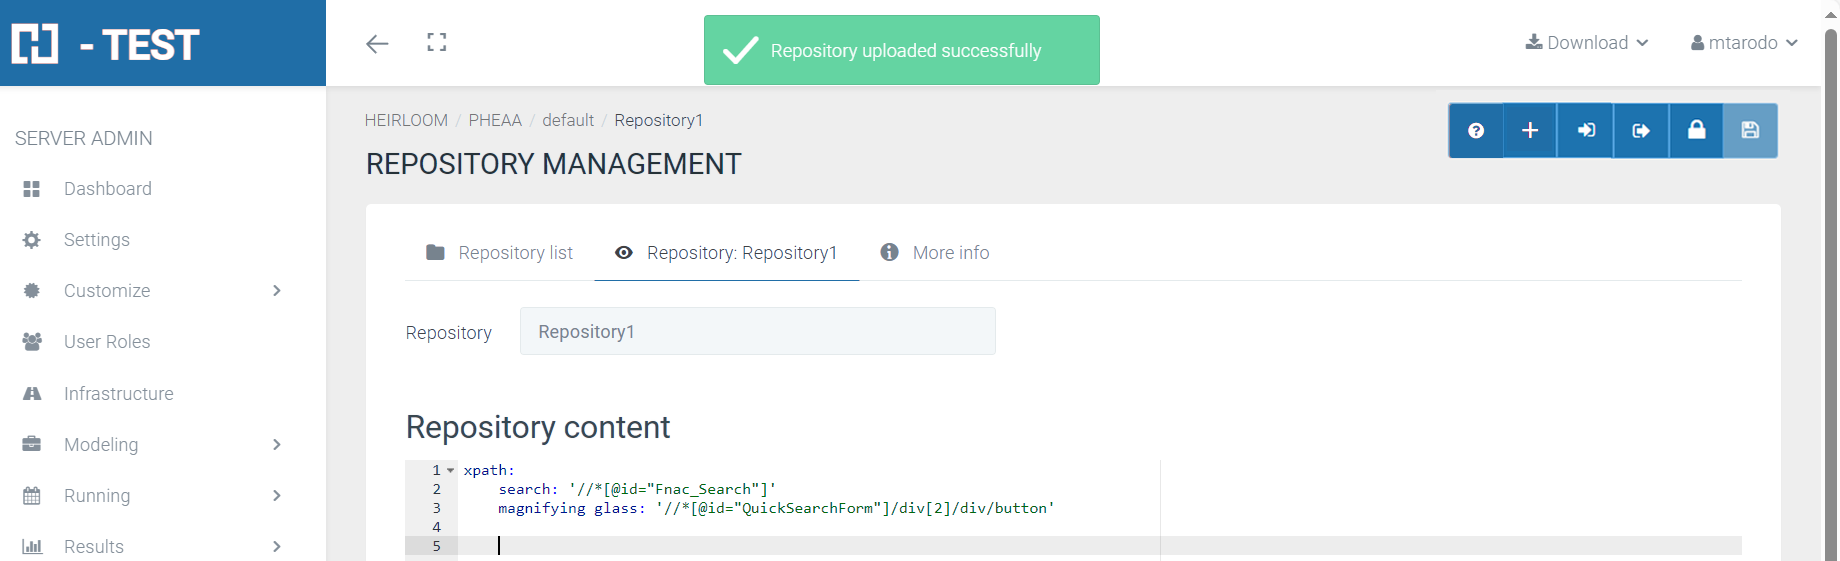
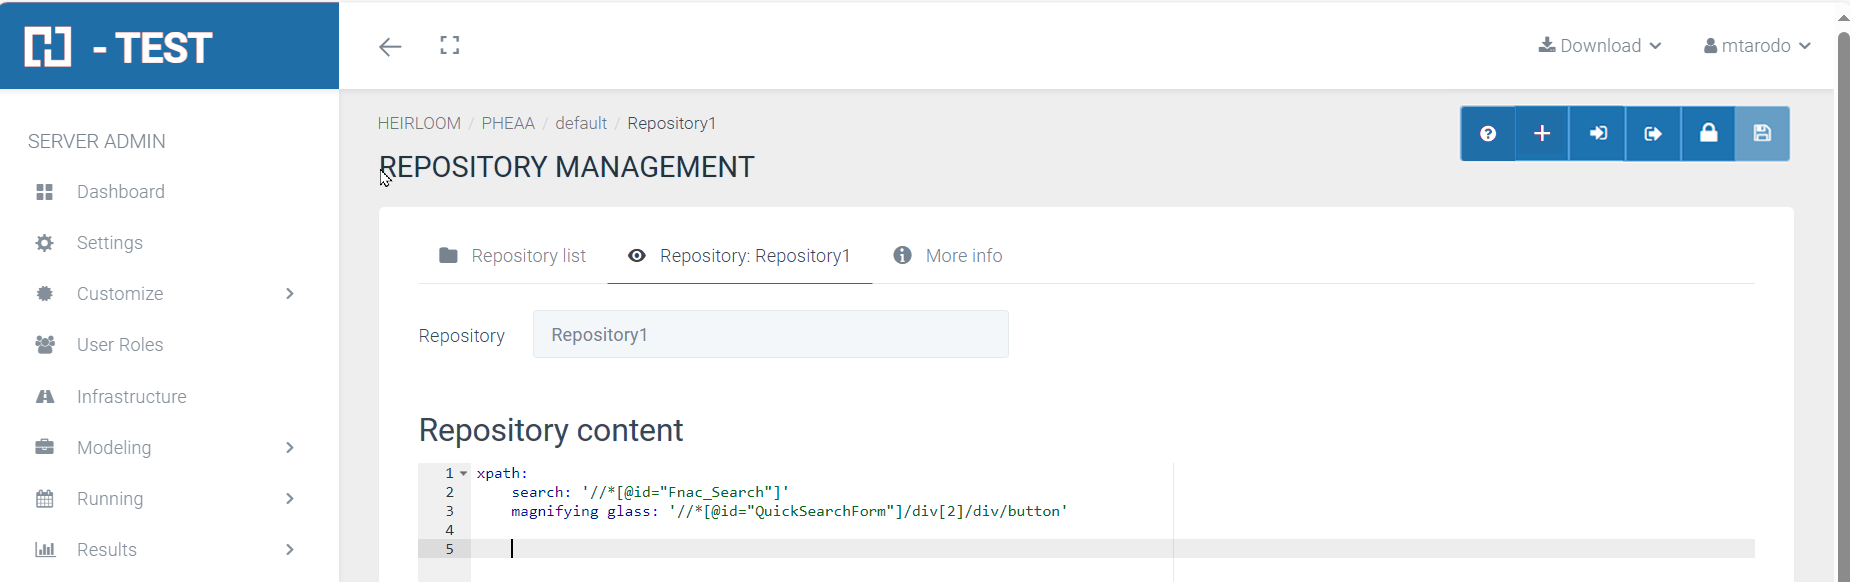
If the TXT/YML file is ok, the importation will be perfect.
But if the file has some kind of error, this message will appear:

This can happen for different reasons:
-
the TXT format is not YML/YAML,
-
there are some kind of error in the file
-
the yml syntax in the repository is incorrect, such as inserting spaces with tab instead of space bar or using a key as a subkey of another, when the value is already defined. To avoid the latter you would have to use an editor such as (Notepad++) with the option to convert tab to spaces.
Changes in modeling
In modeling are some changes about repositories as well.
-
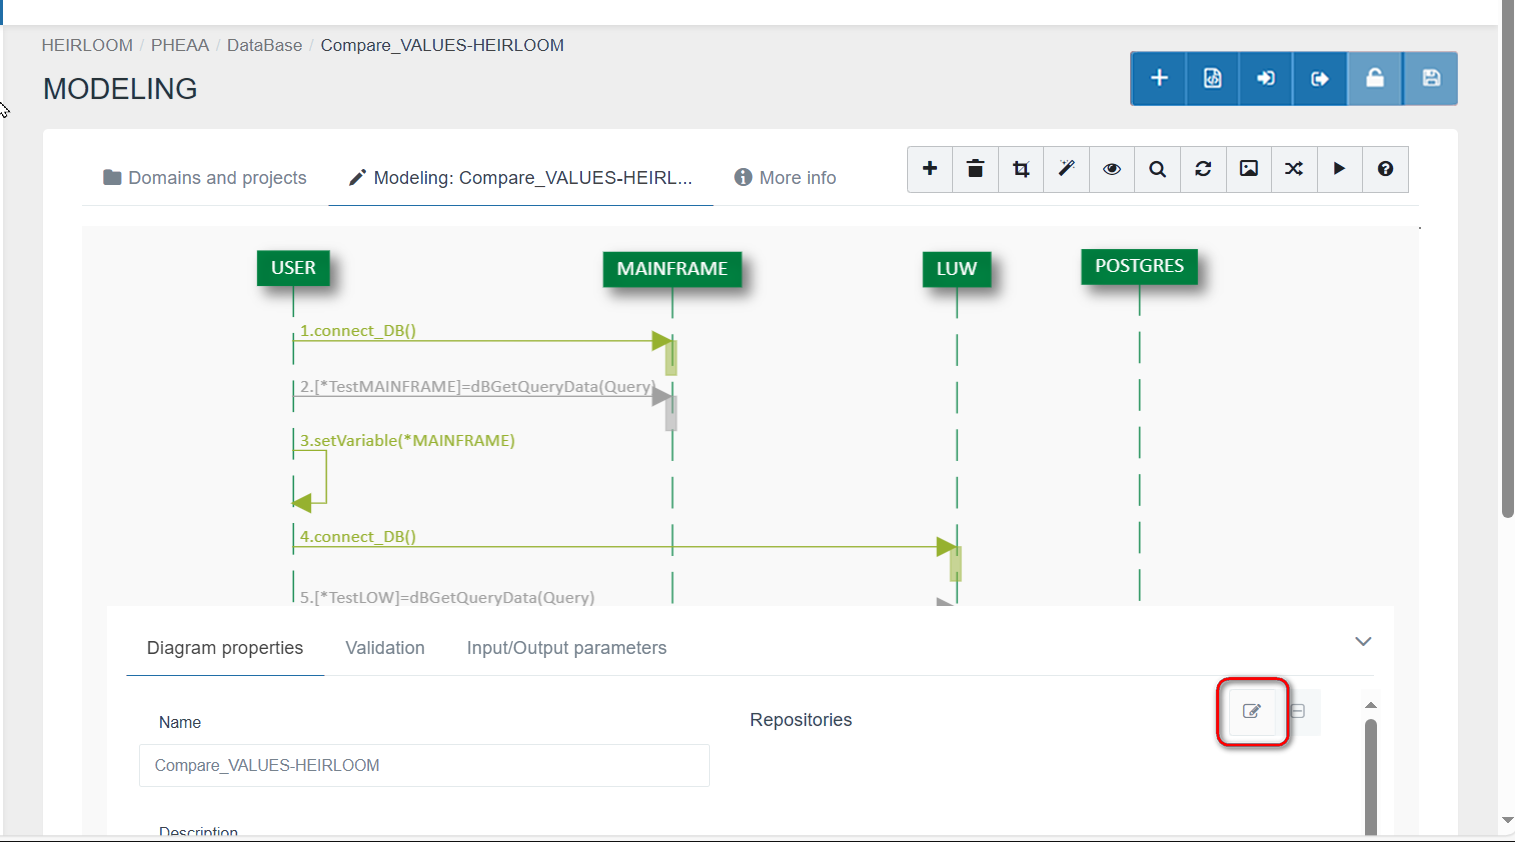
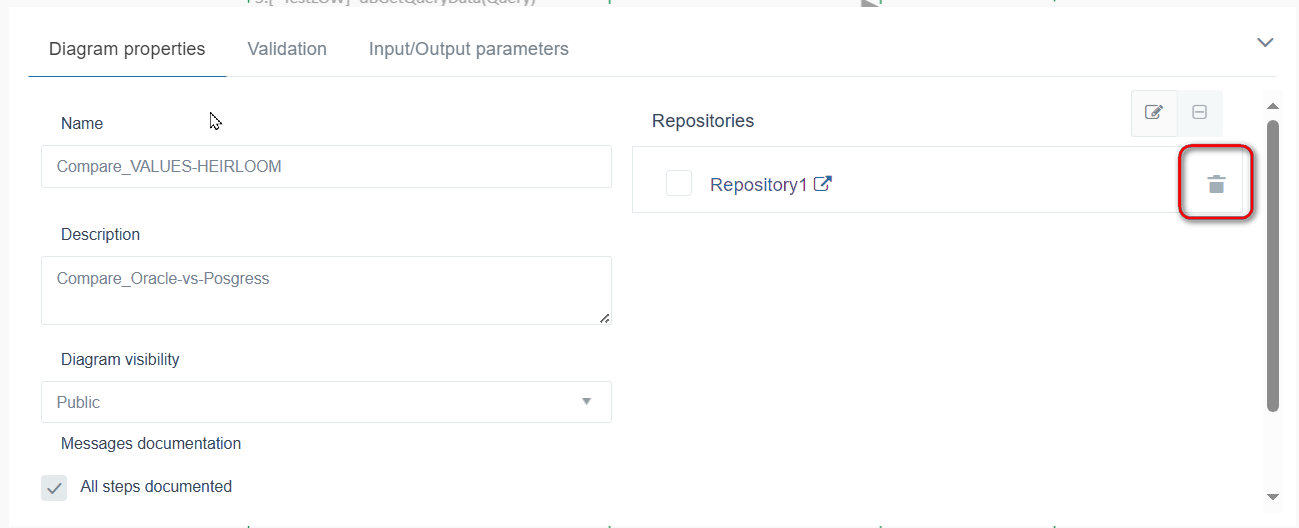
The properties tab in the diagram has been updated to show from now on, information about repositories in the right side.
-
From here the user can add a repository clicking the edit button.
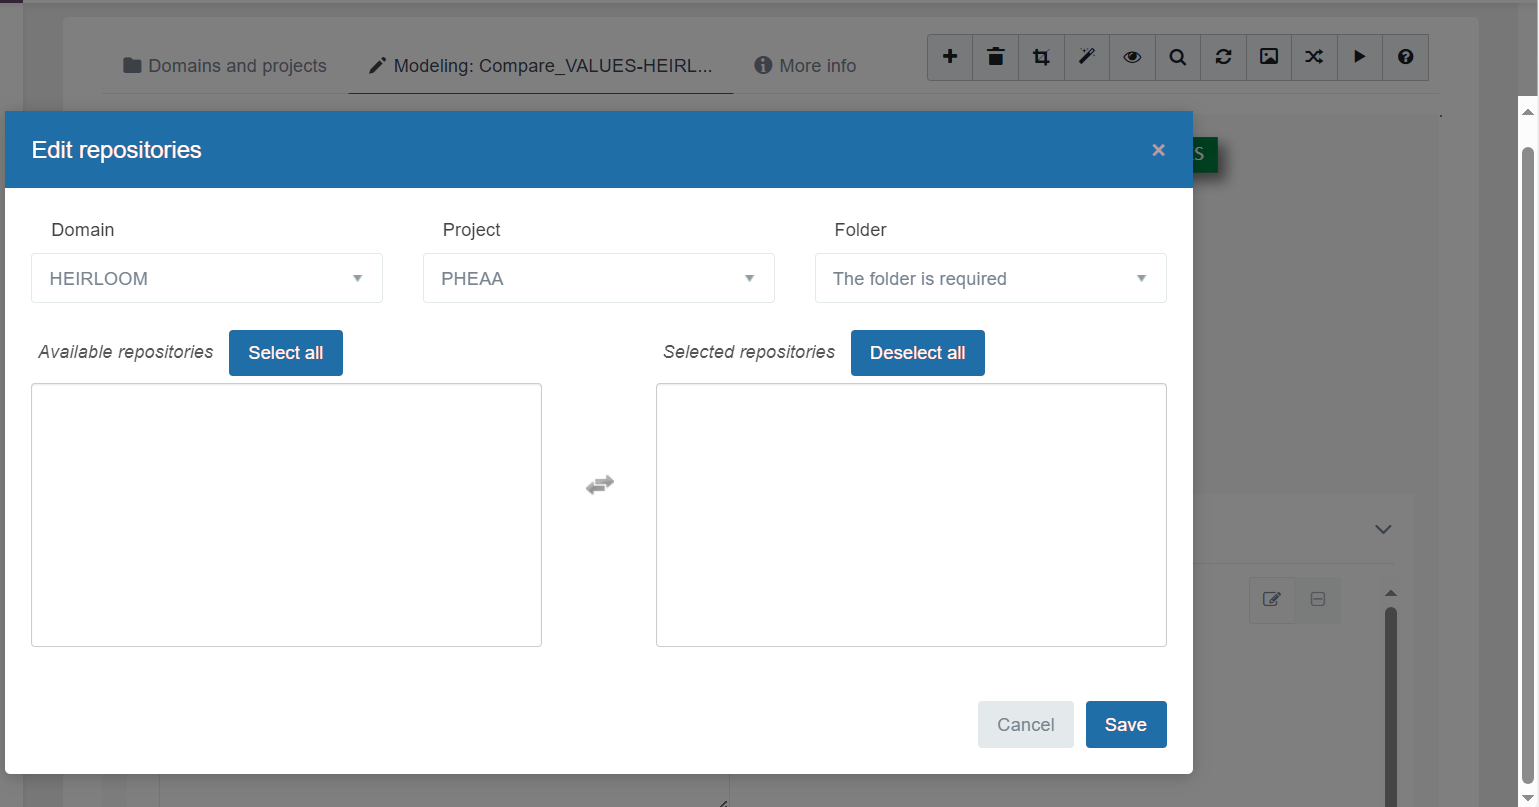
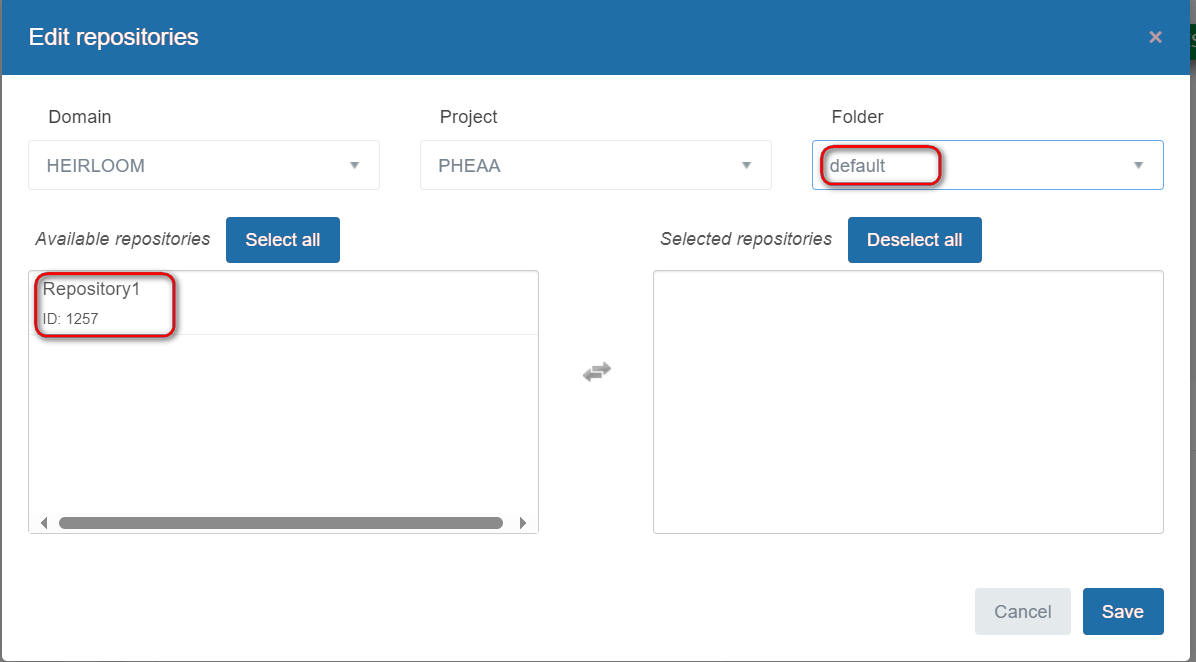
- After clicking the edit button, a modal window will be displayed, as shown in the following image. Through Domain, Project and Folder, we will search for the available repositories.
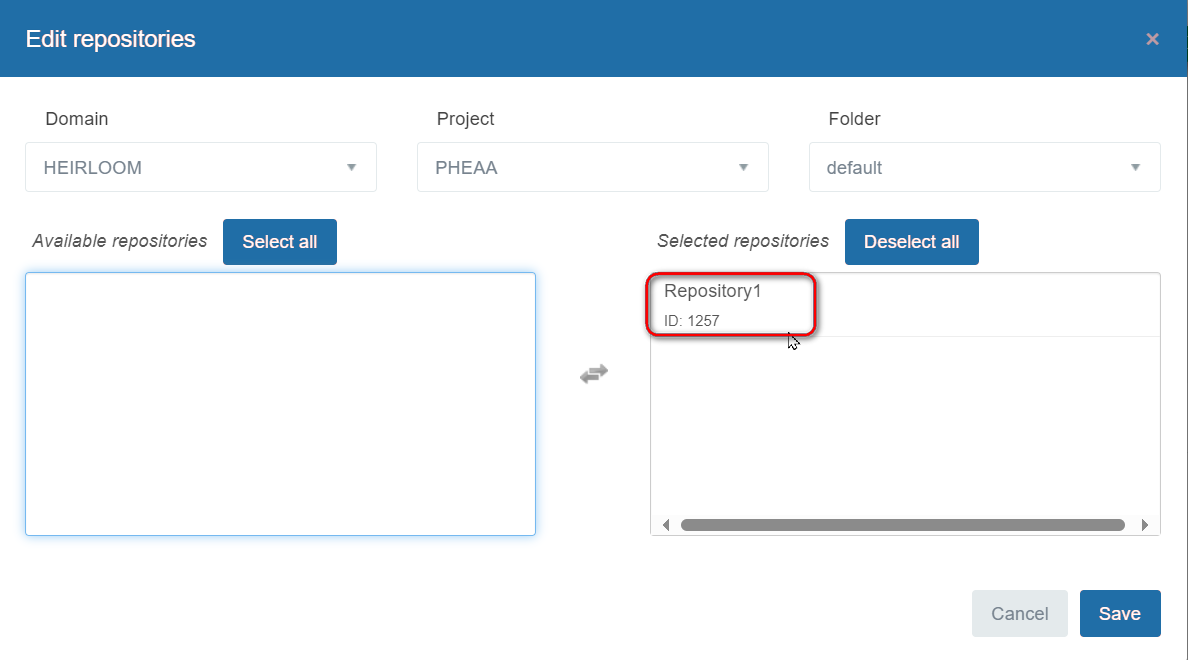
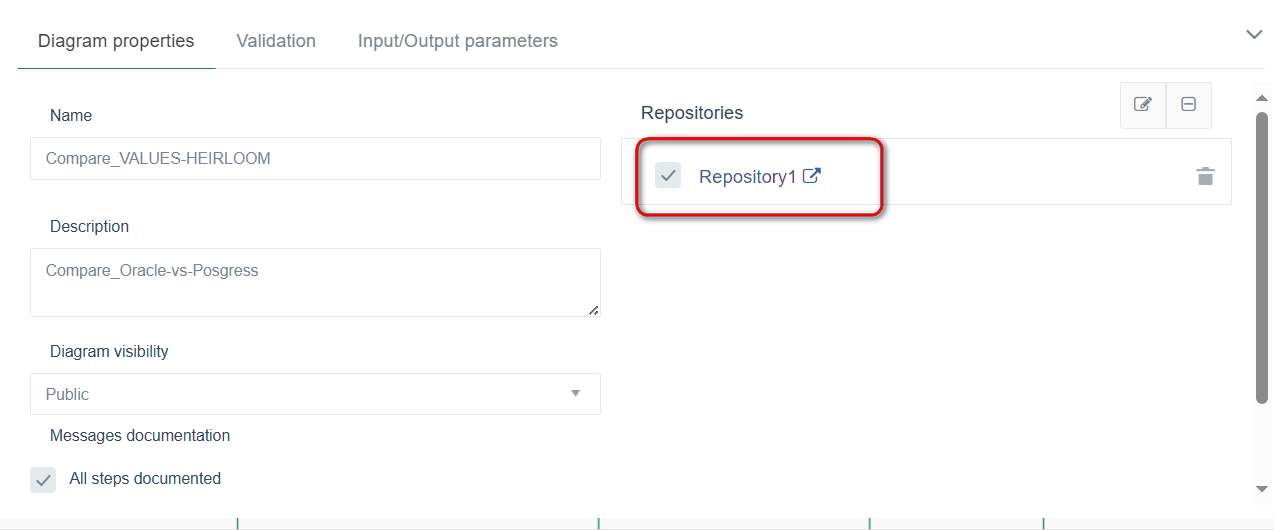
- We can add or delete all the repositories we want. Once accepted it is saved and the diagram is updated with the repositories in the “selected repositories” list box, also this can delete old repositories from the diagram in case there was any and add new ones. Although the repositories are enabled immediately after selecting them, the relation repository-diagram can´t be confirmed until the diagram is saved.
-
To delete a repository from the diagram properties, just click the thrash can icon in the repository´s row and the repository will be deleted with all the connections that could have with the diagram messages.
-
To go to the repository, click in the repository name and it will act as shortcut going to repository management exactly where the repository is.
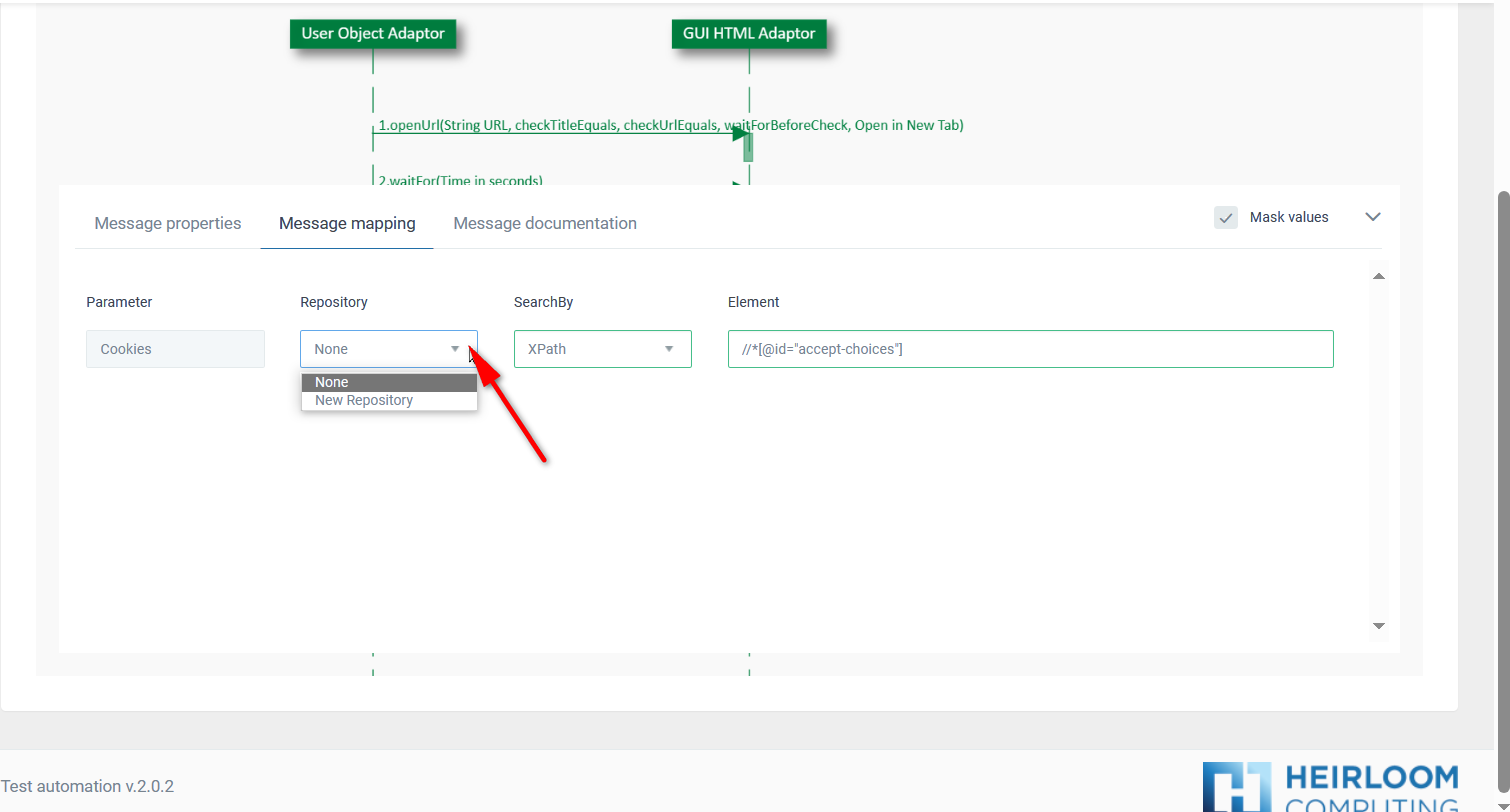
- There are also updates in the messages section. As can be seen in the image, a drop-down field “Repository” has been added from which you can choose the repository you want to use in this parameter. Once the repository is chosen, the next step is to select “Repository” in the SearchBy field. And in the “Element” field you can use the repository keys as variables after typing hash ”#”, and have Repository and searchBy selected.
- Once you set the pad it is possible to autocomplete with the repository keys, as shown in the following image. To use these keys, the variables are generated by concatenating the levels of the keys with “_” (underscore), until the value is reached so the keys should be used as variables separated by “_” as shown in the glossary section.

-
As an important note, do not use in the names of the properties of the repository names composed by “_” because when concatenating these, it could cause some error.
Library Management
Introduction
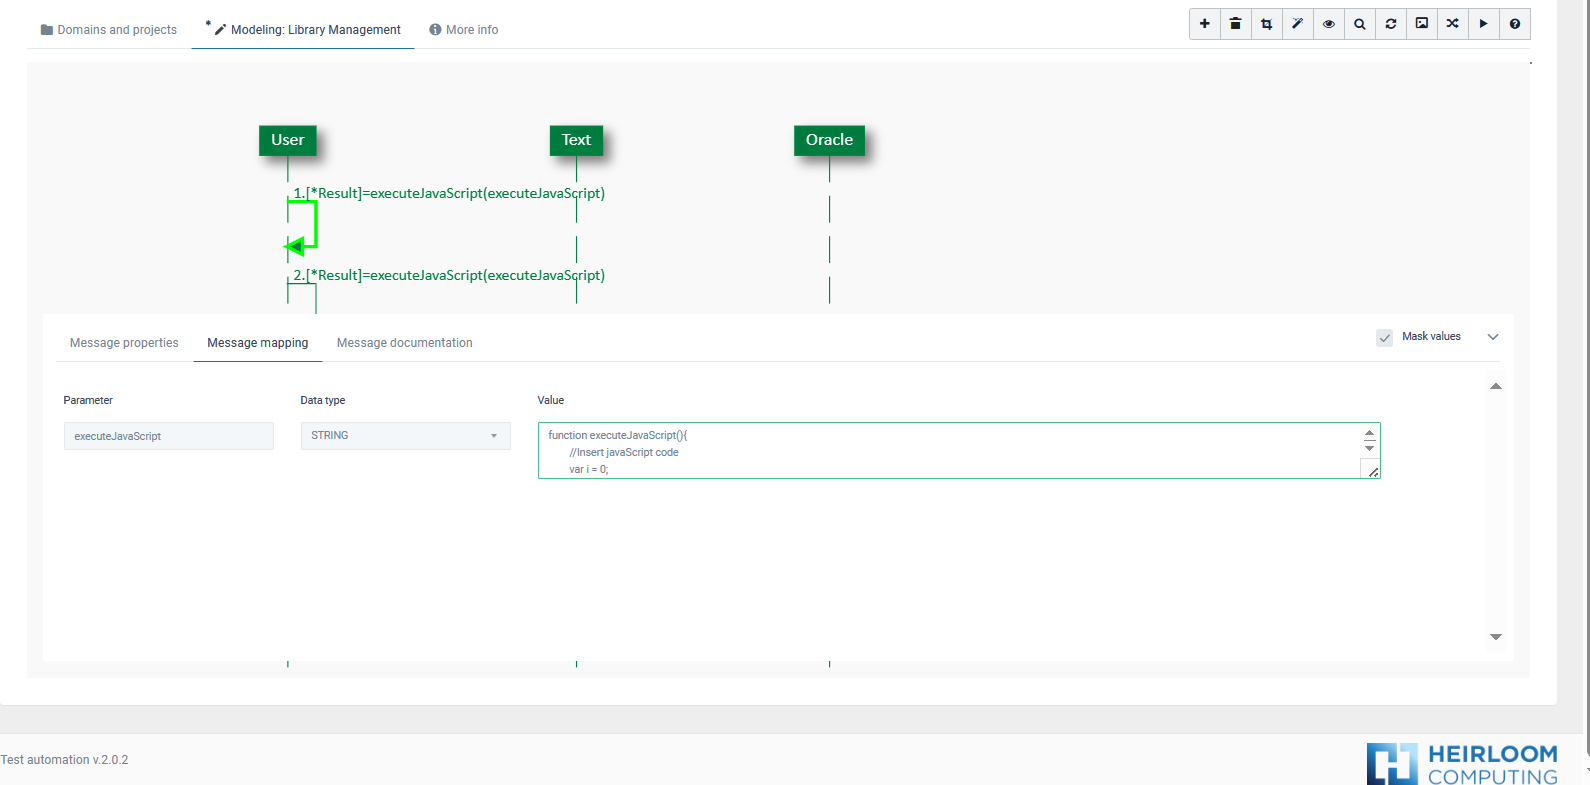
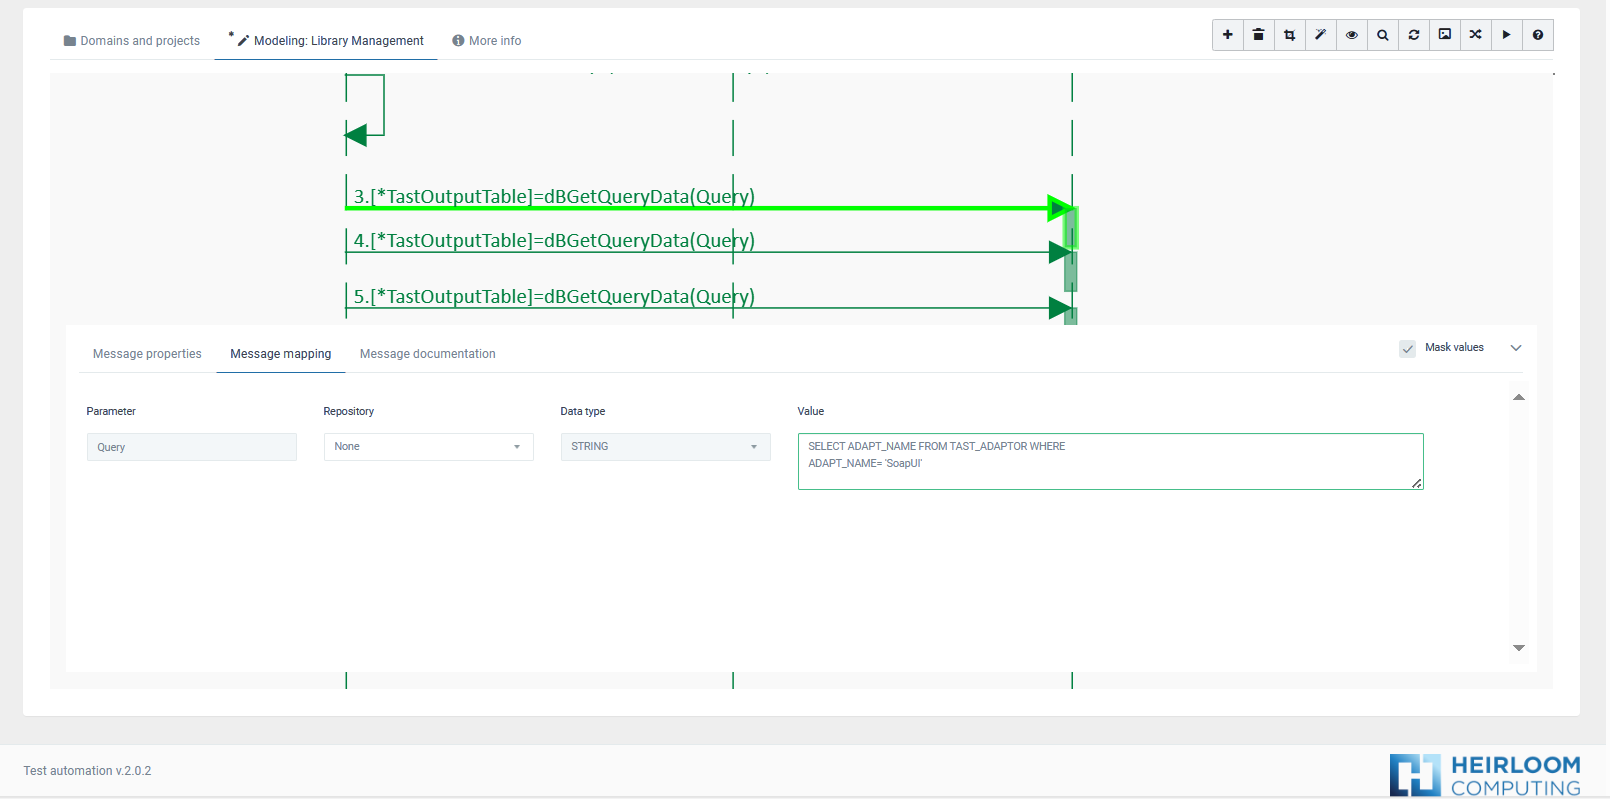
Library Management provides H-Test, and specifically the diagram modeling part, with a library management tool to store, organize and query javascript functions or Sql queries that the user considers useful, for example to be reused in the messages of other diagrams.
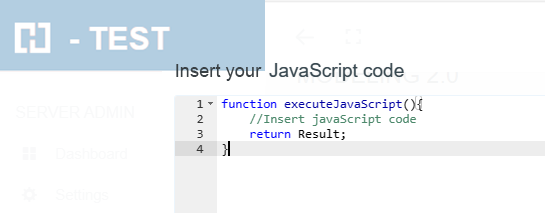
Predefined functions such executeJavascript or dbGetQueryData, are examples of messages that include a javascript code or a sql query:
Library Management Page
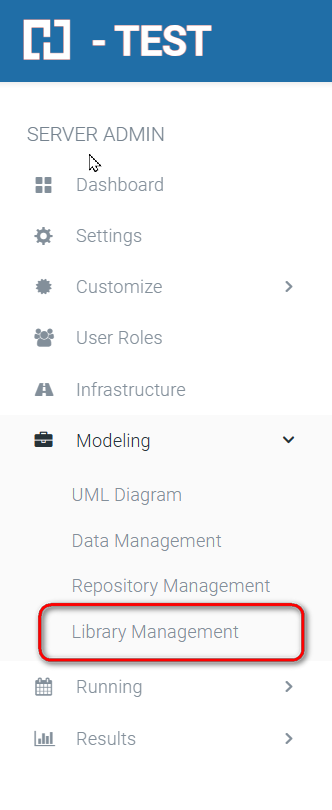
Library Management Menu
Since this is a tool to support diagram modeling, we find Library Management as a submenu within the main Modeling menu:
Library Management screen
In this screen we can create, catalogue, edit and browse library elements:
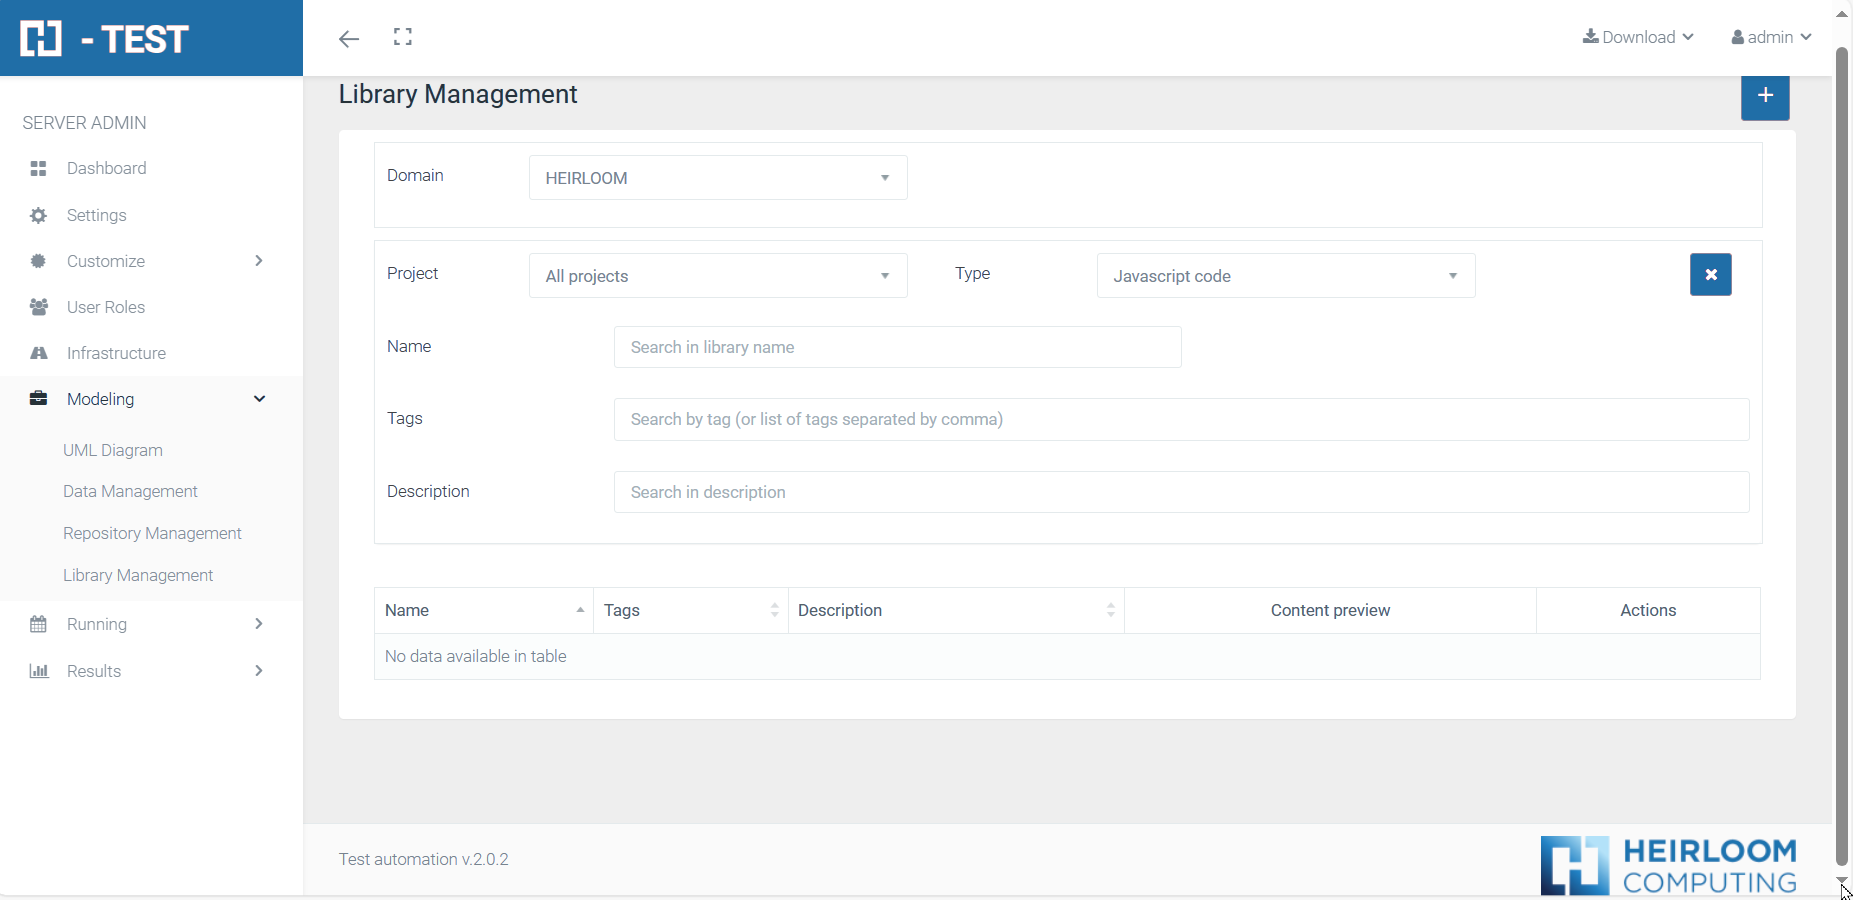
In the following we will see each of the different functionalities of the screen.
Create a New library item
![]() By clicking this button at the top right of the screen, a form appears where the user fills in the fields to register the new library item:
By clicking this button at the top right of the screen, a form appears where the user fills in the fields to register the new library item:
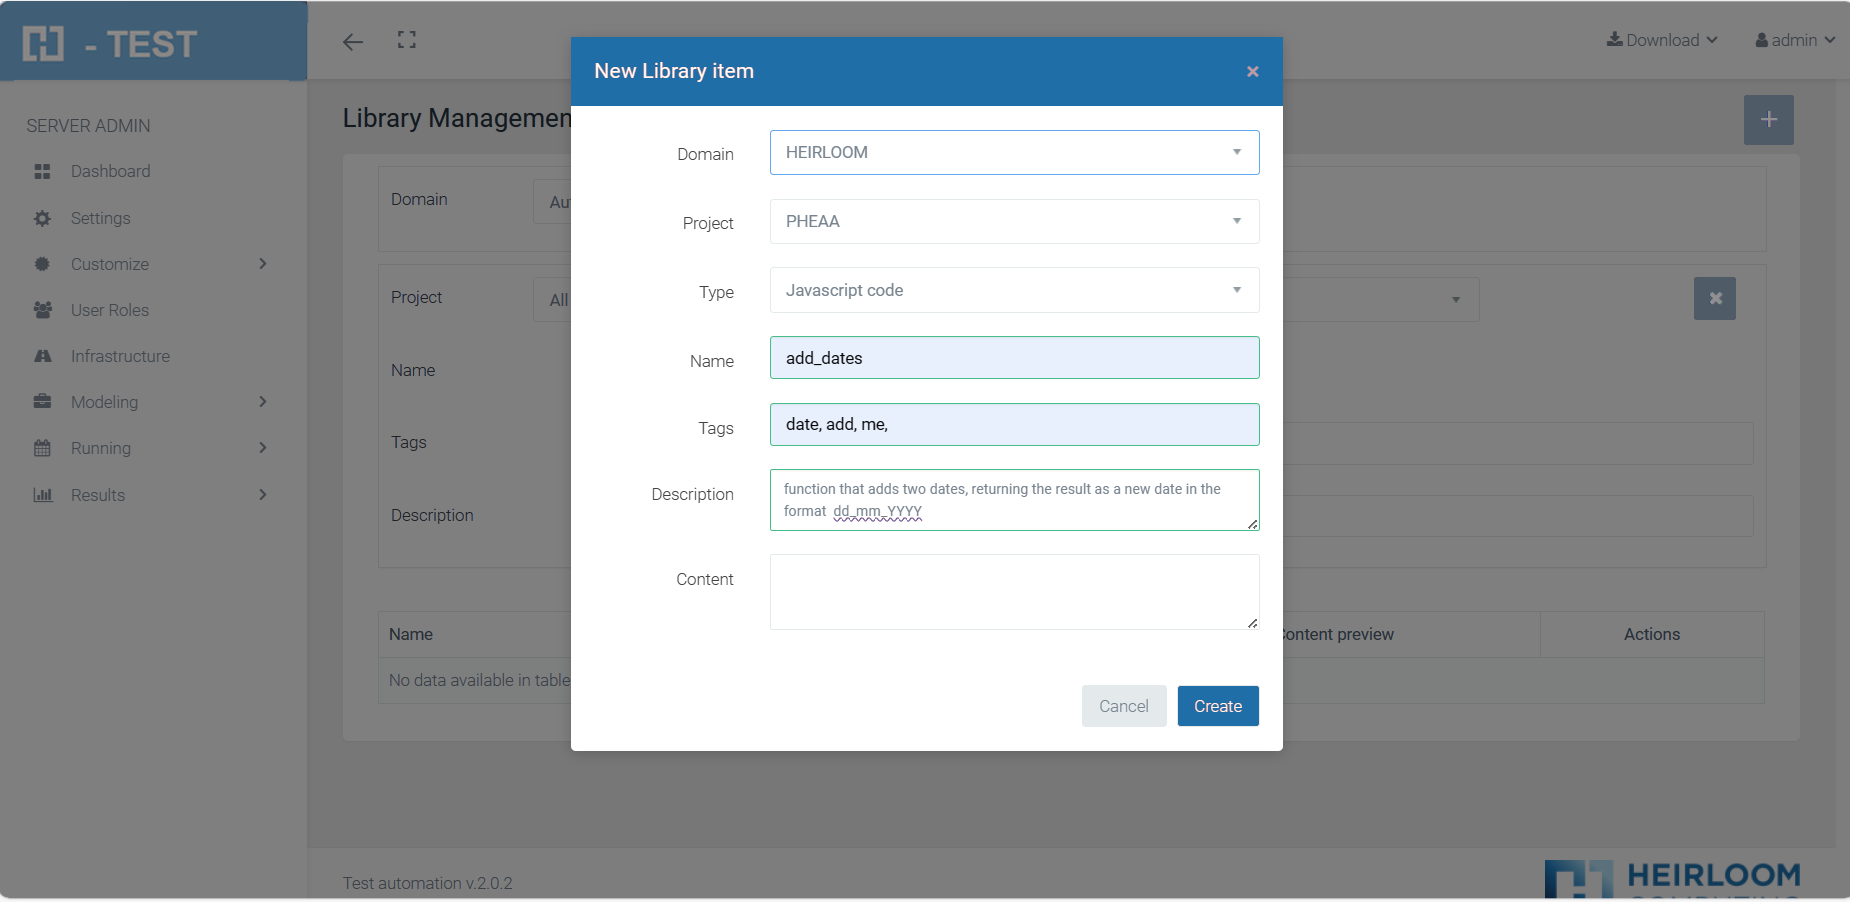
All these fields are mandatories and cannot be empty.
These fields are listed below:
The user has to select a domain and a Project inside it where to save the new item. All users belonging to that Project have access to any of its library items.
Select the type of element you are creating, being one of these:
- Javascript function
- Sql Query
Text field to enter a sufficiently descriptive name that identifies the item and subsequently facilitates searches. It cannot contain spaces.
Text field to enter one or more tags (separated by commas) sufficiently descriptive to facilitate cataloging and searching.
Text field to enter a sufficiently descriptive description to facilitate the understanding of the content. For example, in the case of a javascript function, you can briefly describe what the function does, what parameters it receives and what result it returns.
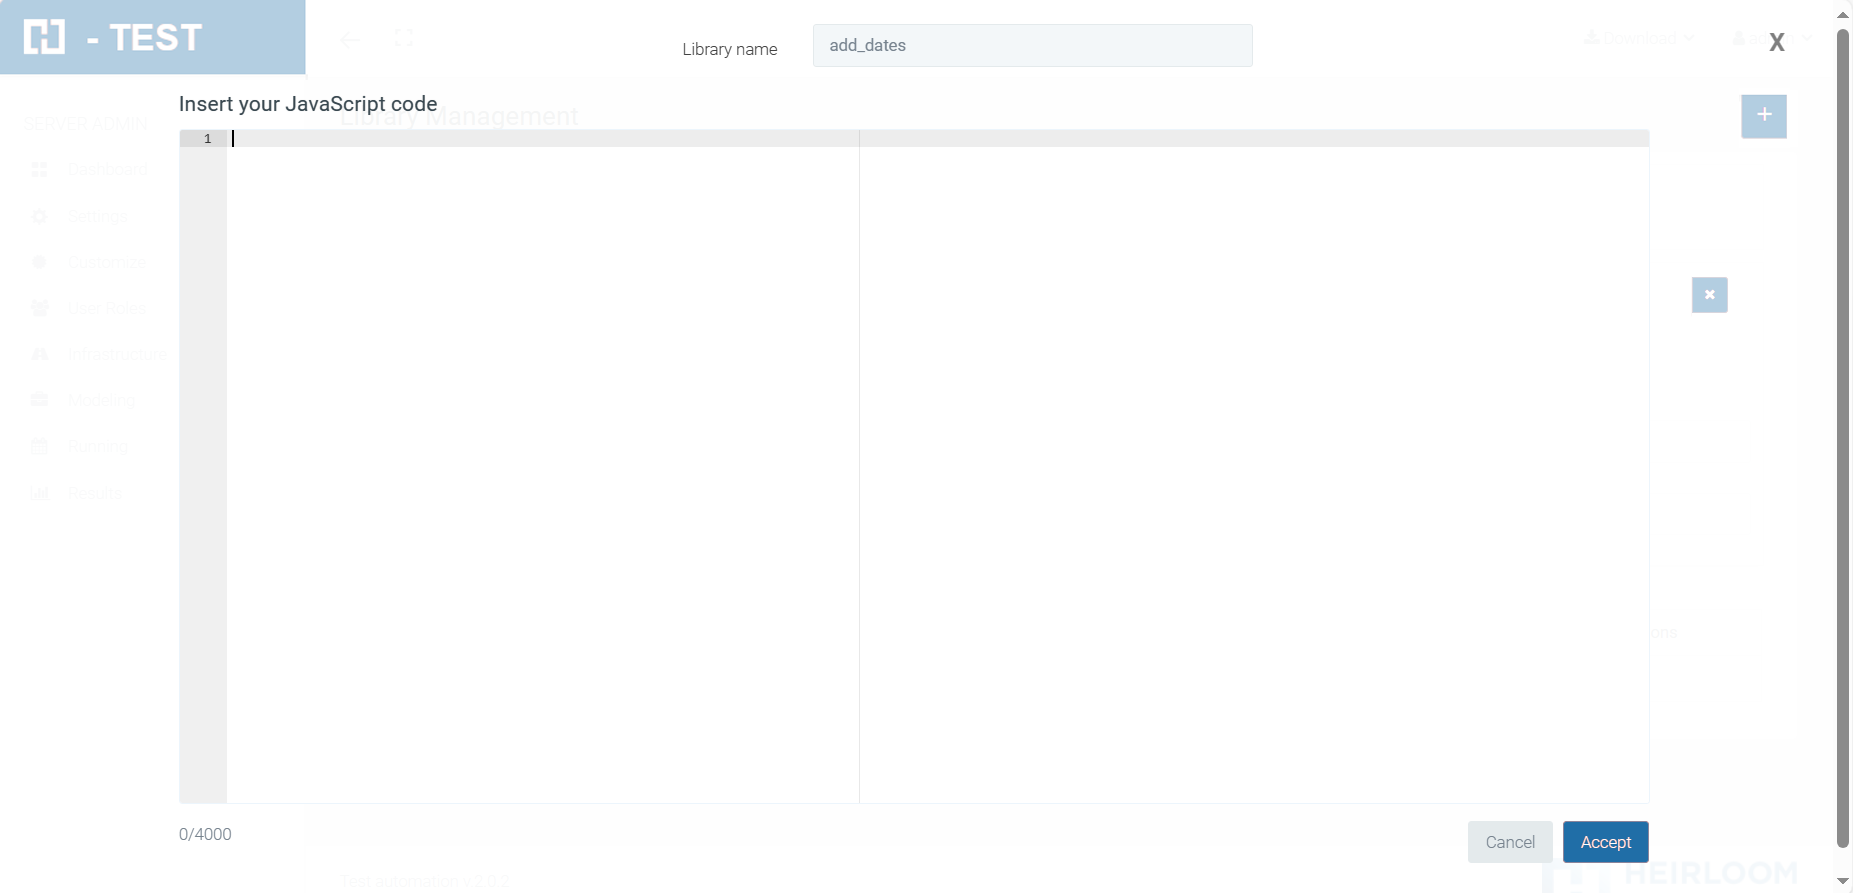
By clicking on this field, it expands and takes us to a modal window with the special code editor for entering Javascript or Sql code.
This editor supports copy/paste events from any other editor.
Select Domain
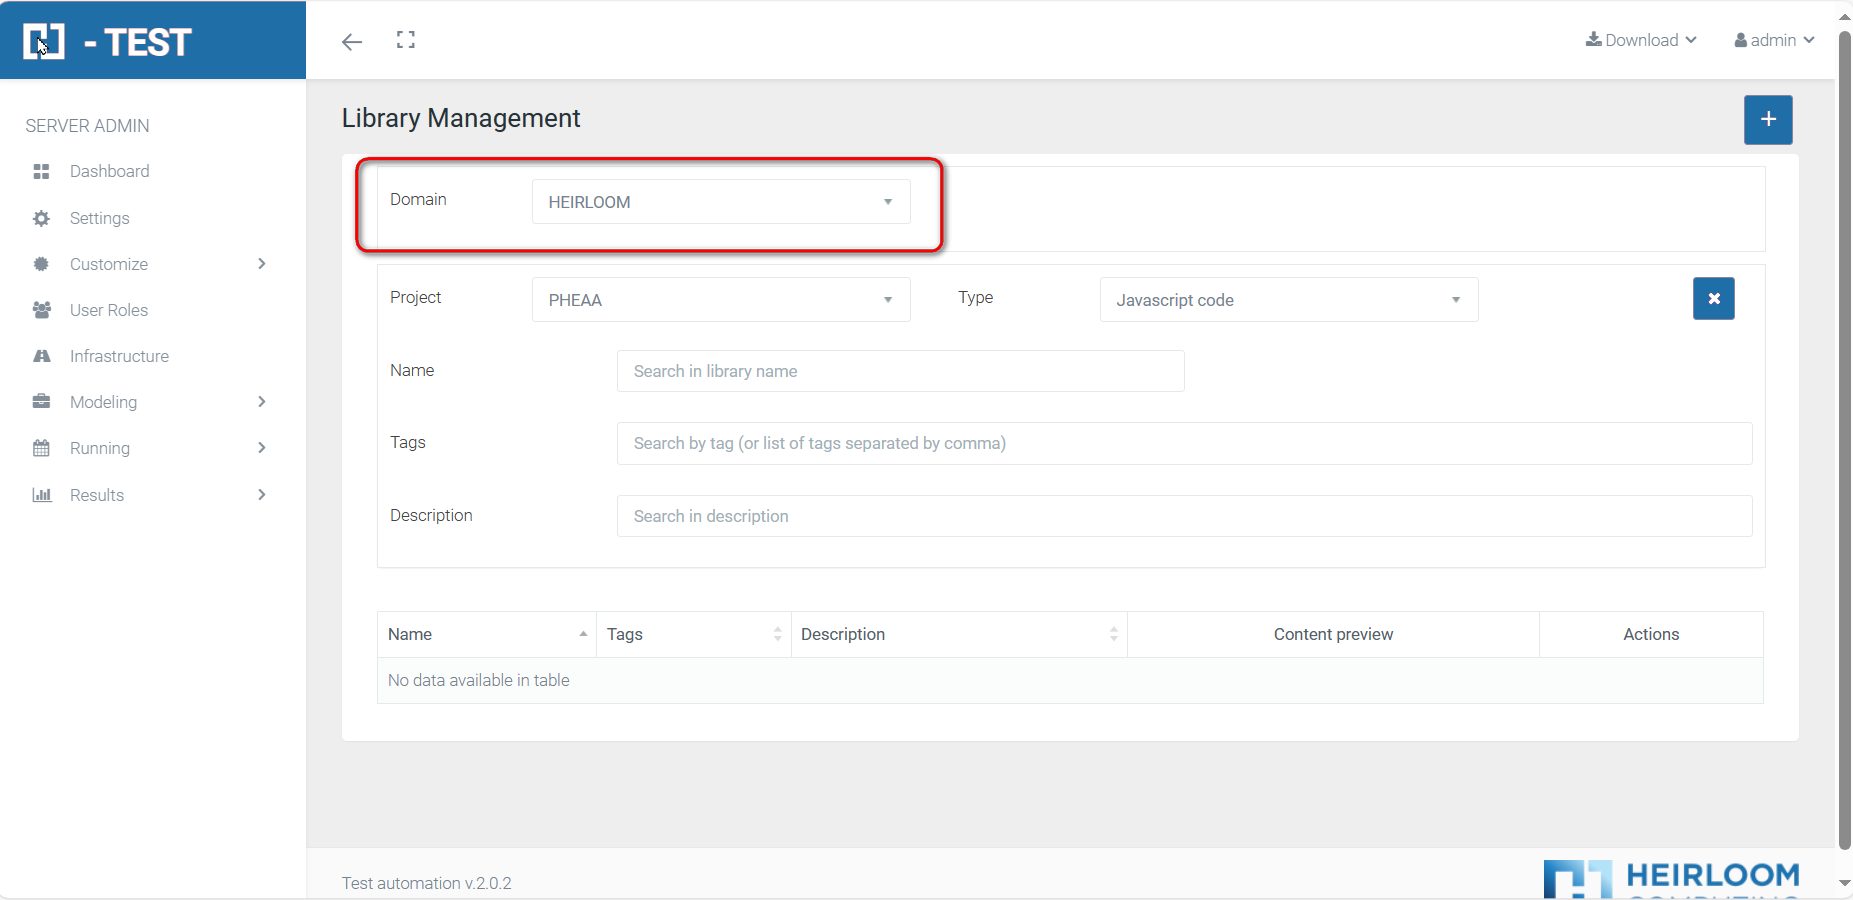
The Library Management page initially lists those items belonging to the current domain. All users who can access this domain can have access to all library items stored in it.
Filters: searching for ítems in libraries
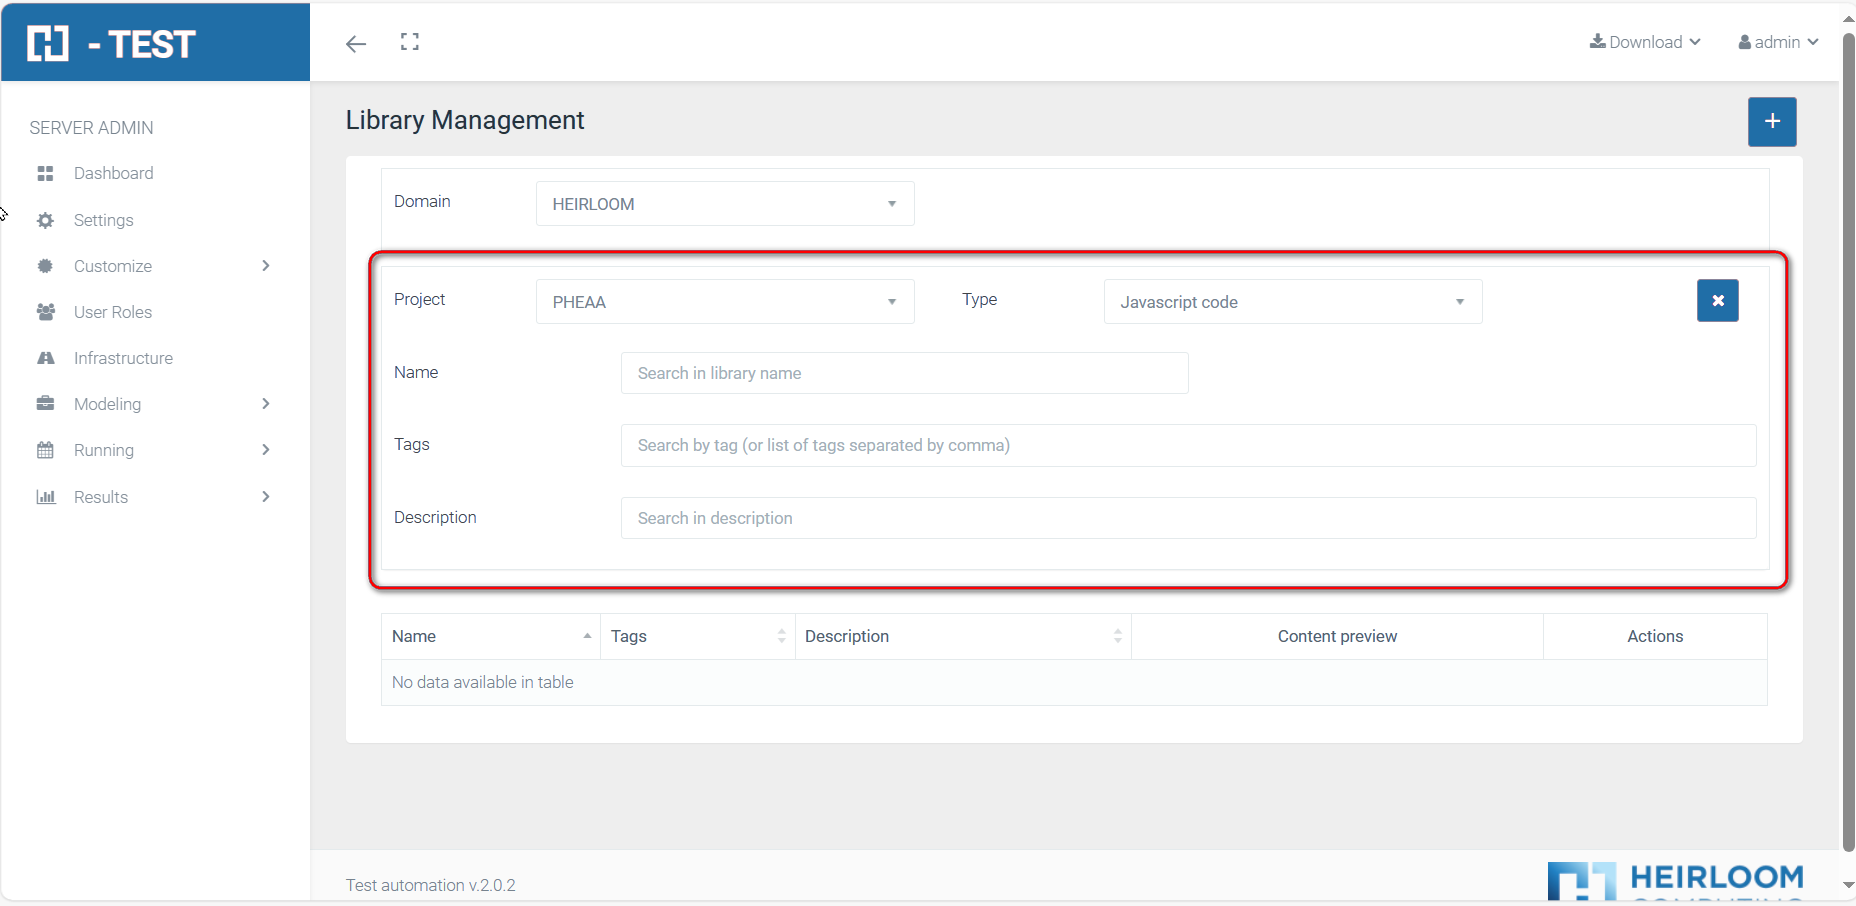
As mentioned above, all items belonging to the current domain will initially appear in the list.
Later, the user can then refine their search using any of the filters provided, either individually or in combination.
You can filter the results according to your project, by default all items within the domain will be displayed.
2. Type
The items are listed by their type: Javascript code or Sql query.
3. Name
If you want to filter results by item name, type a string in this field and press ENTER to accept. The list will show the items whose name is equal to or contains the string entered in this field.
If you want to filter results by item tags, type one or more tags in this field (separated by commas) and press ENTER to accept. The list will show the items whose tags are the same or contain any of the tags entered in this field.
If you want to filter results by item description, type a string in this field and press ENTER to accept. The list will display items whose description is equal to or contains the string entered in this field.
![]() Click on the "Clear filters" button when you want to clear the fields and reset them to their initial state.
Click on the "Clear filters" button when you want to clear the fields and reset them to their initial state.
Table or Results list
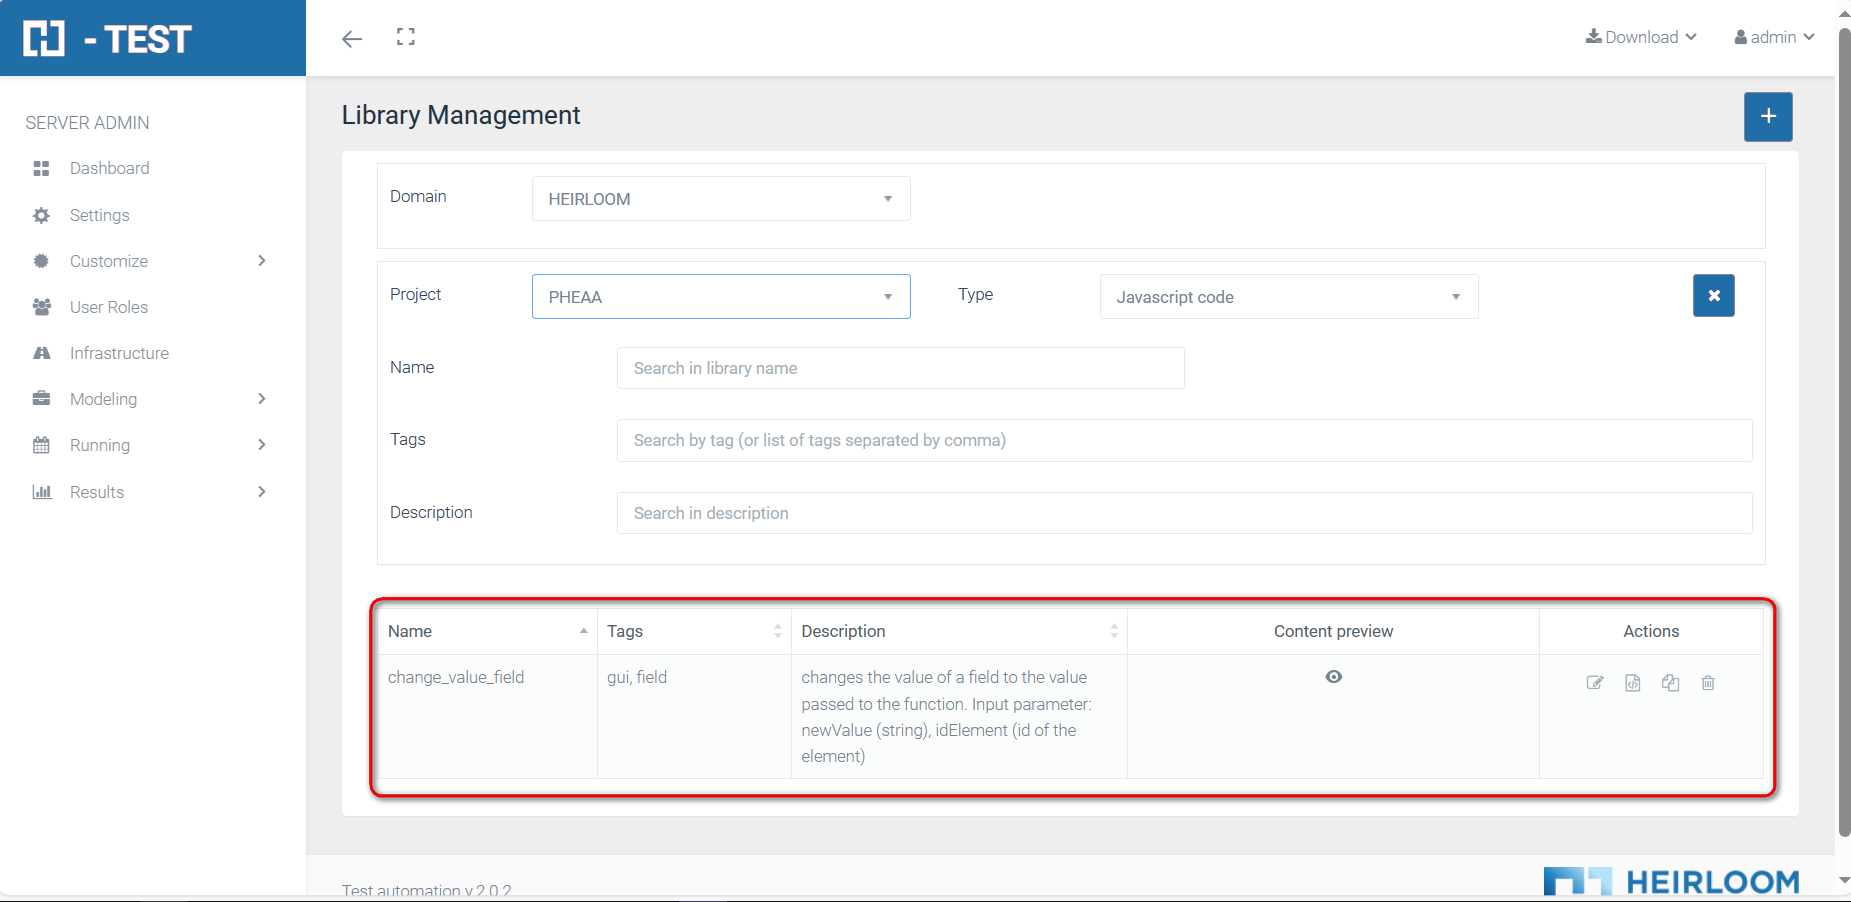
The list or table of results shows the library items found according to the search criteria at any given time.
2. Content preview column:
![]() By clicking on the "eye" icon, it expands a preview of the item's content, as well as the last user who edited it:
By clicking on the "eye" icon, it expands a preview of the item's content, as well as the last user who edited it:
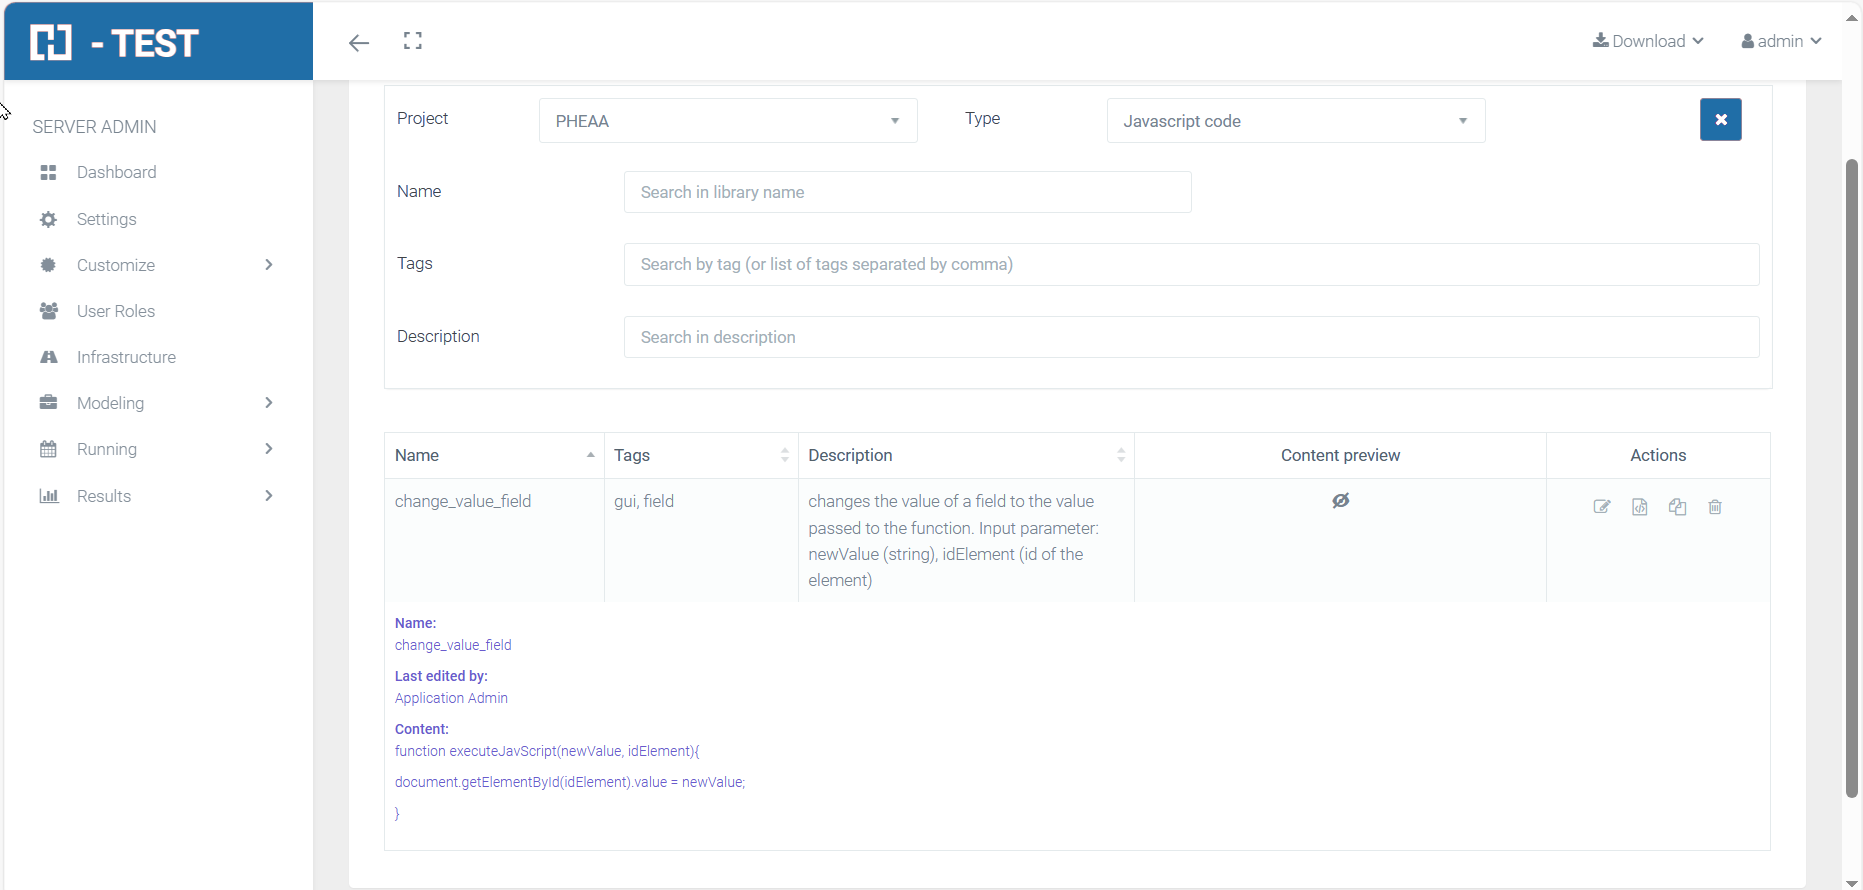
![]() Click on the icon again to collapse the preview.
Click on the icon again to collapse the preview.
3. Actions column:
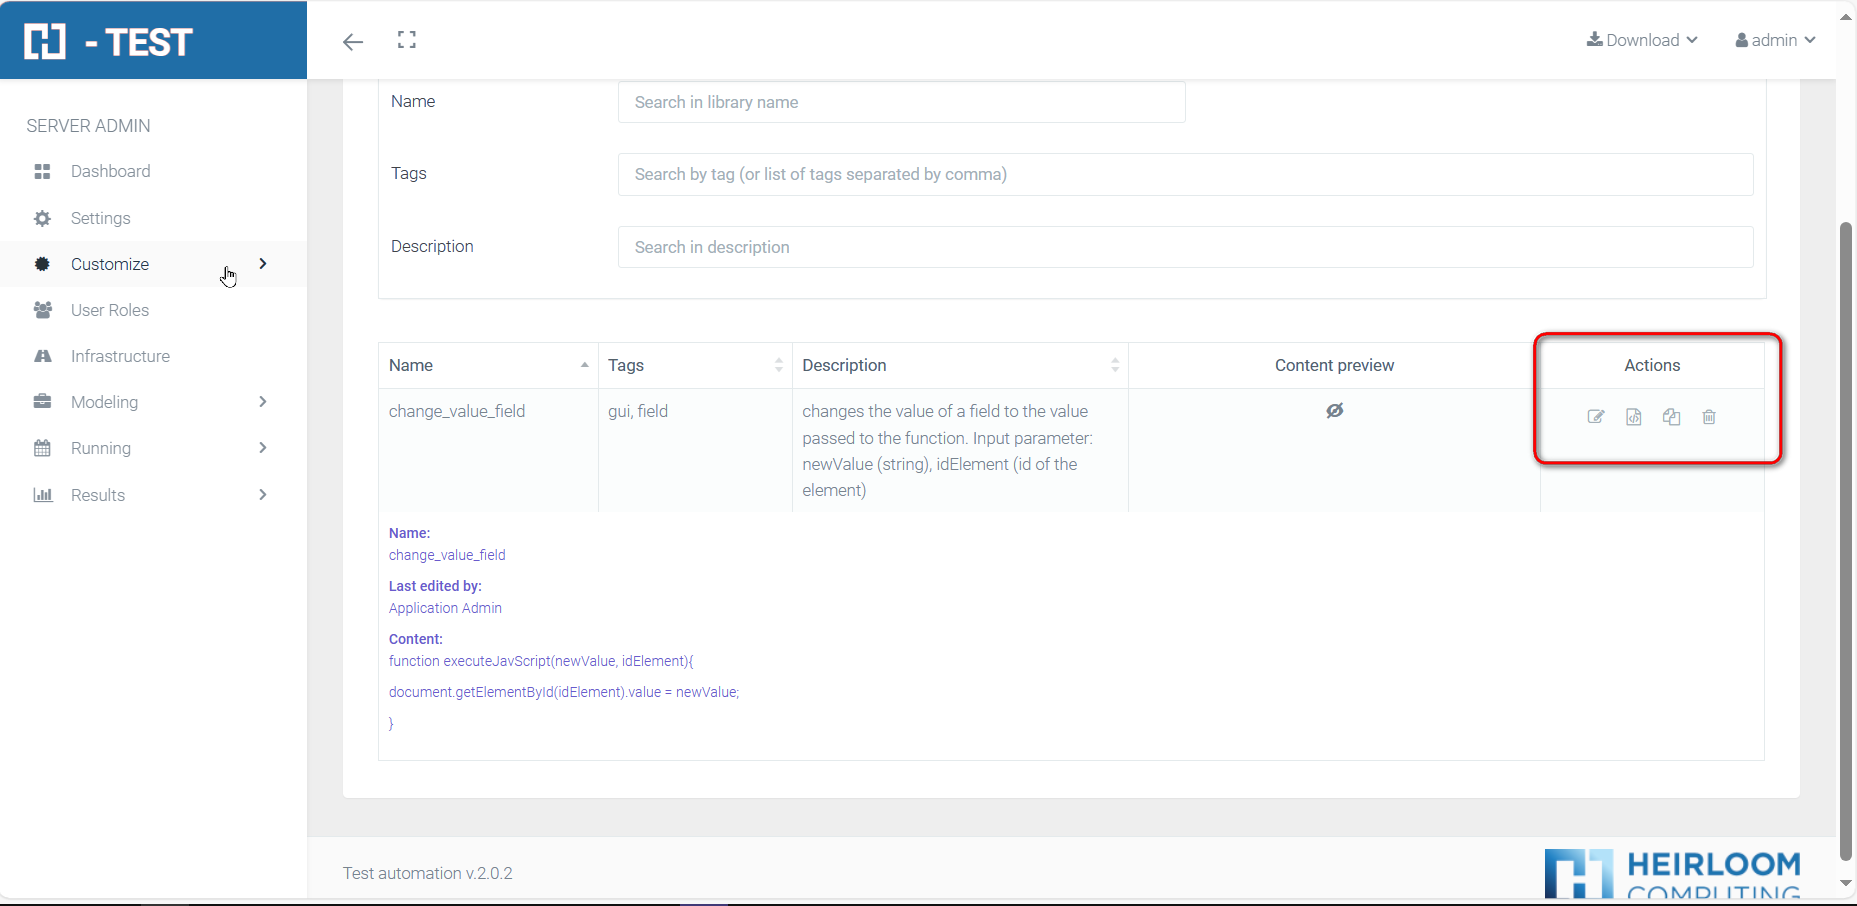
It contains a number of buttons to perform actions on each library item: edit, edit content, copy and delete.
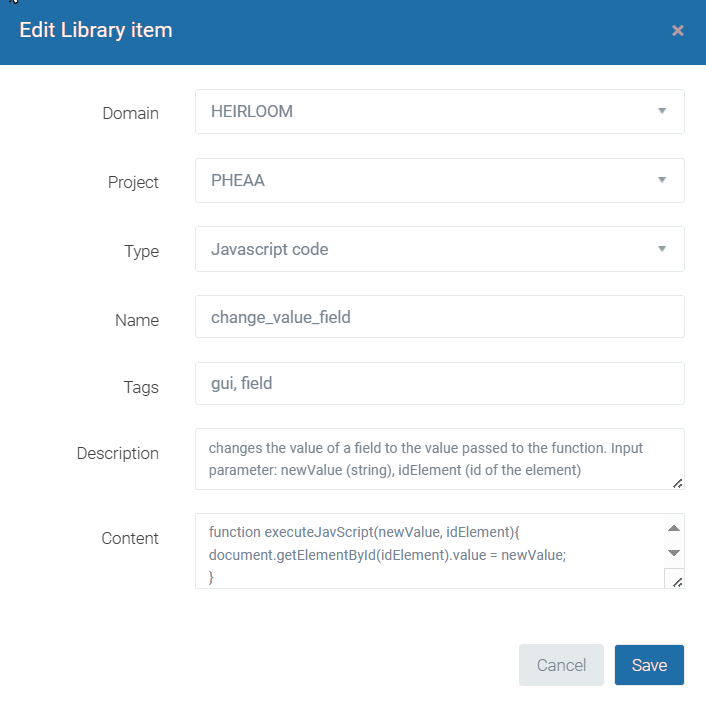
Edit a library item
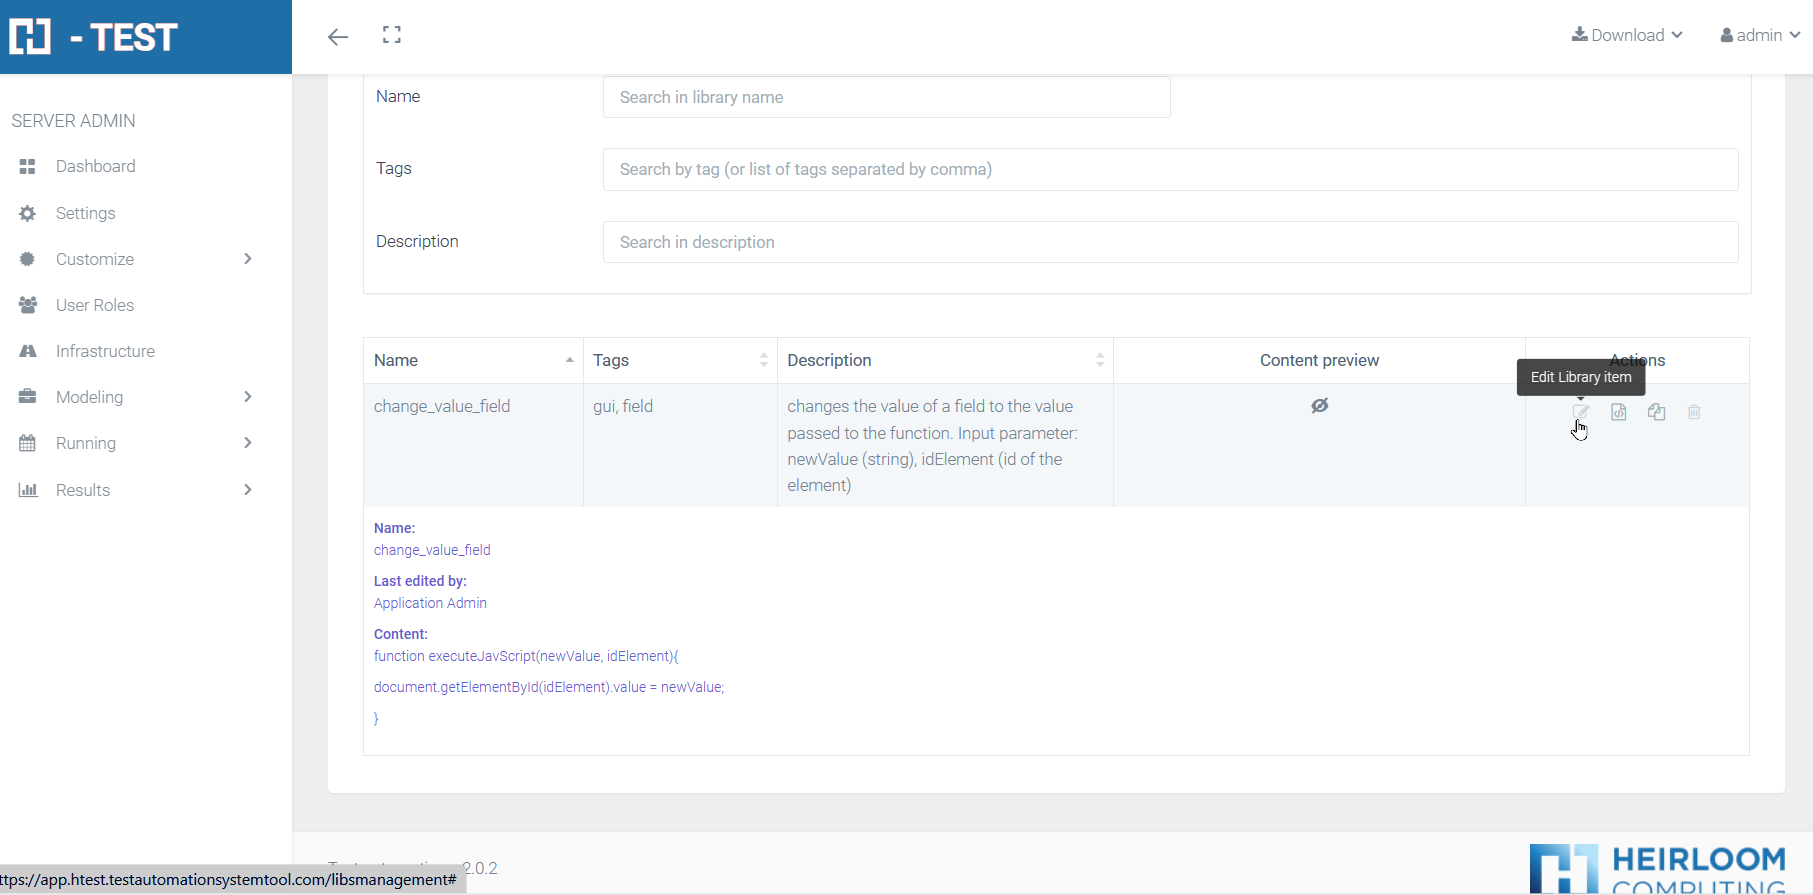
Clicking the Edit library item button in the Actions column displays a form where the user can modify any of the fields and save it again. This action also checks that no other user is editing the item at the same time.
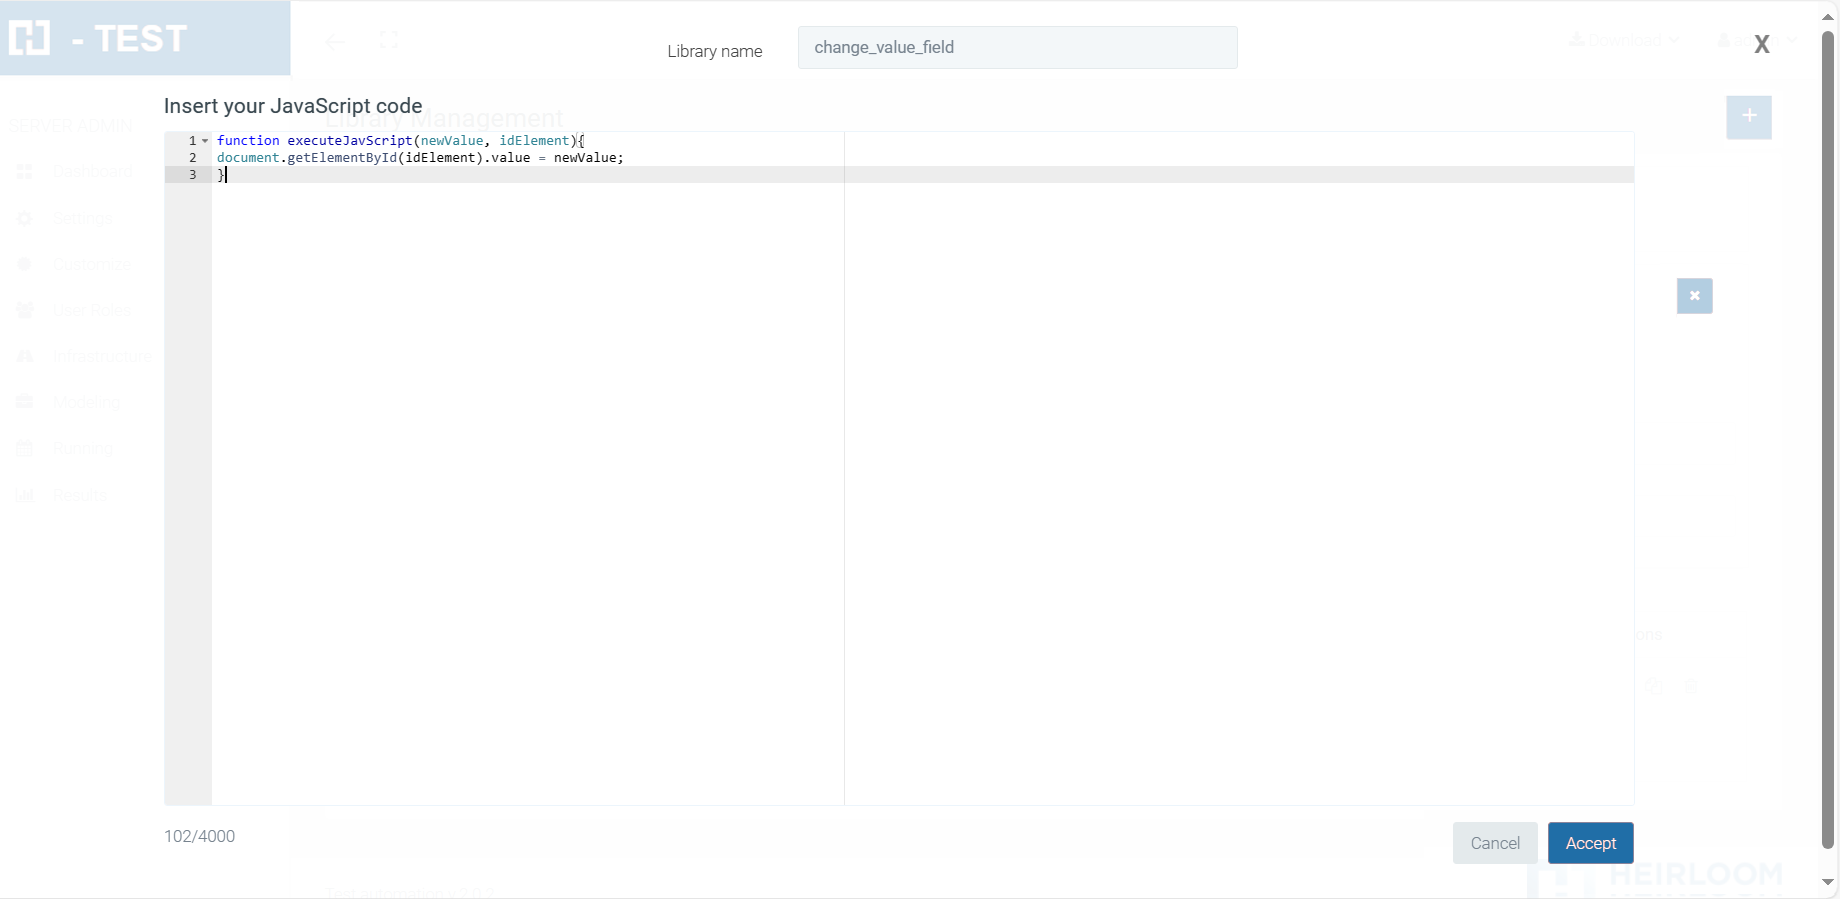
Edit the content of a library item
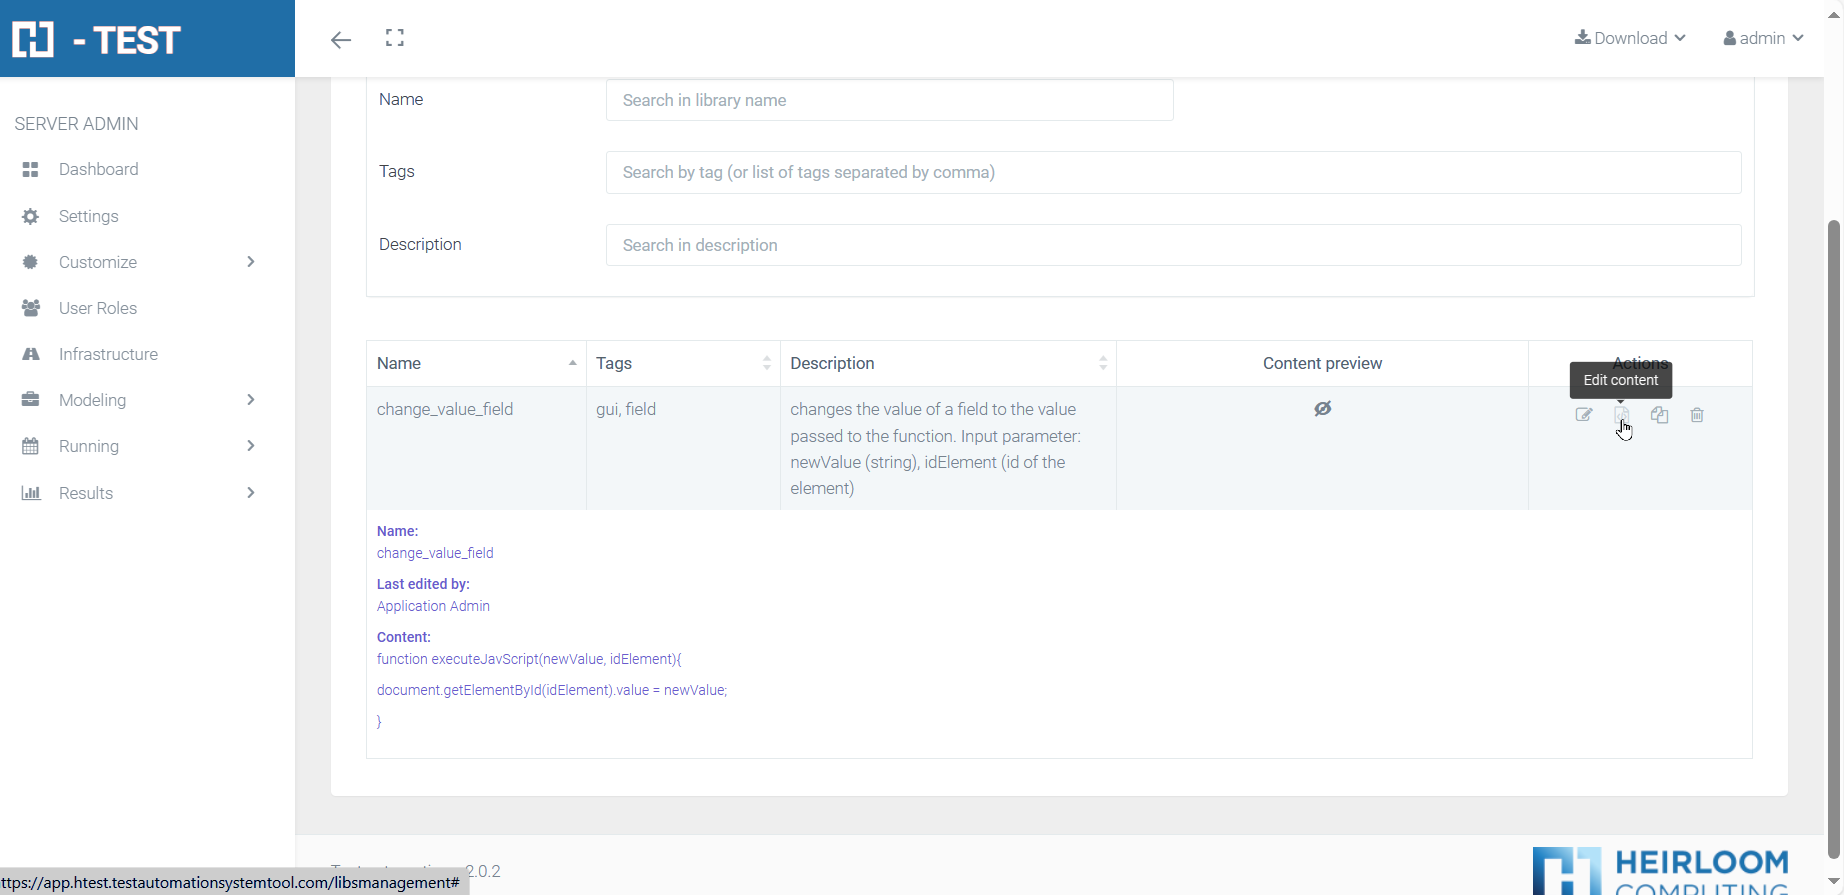
Clicking on the Edit content button in the Actions column takes you directly to the code editor, where the user can modify the javascript or sql code of the item and save it again. This action also checks that no other user is editing the content of the item at the same time.
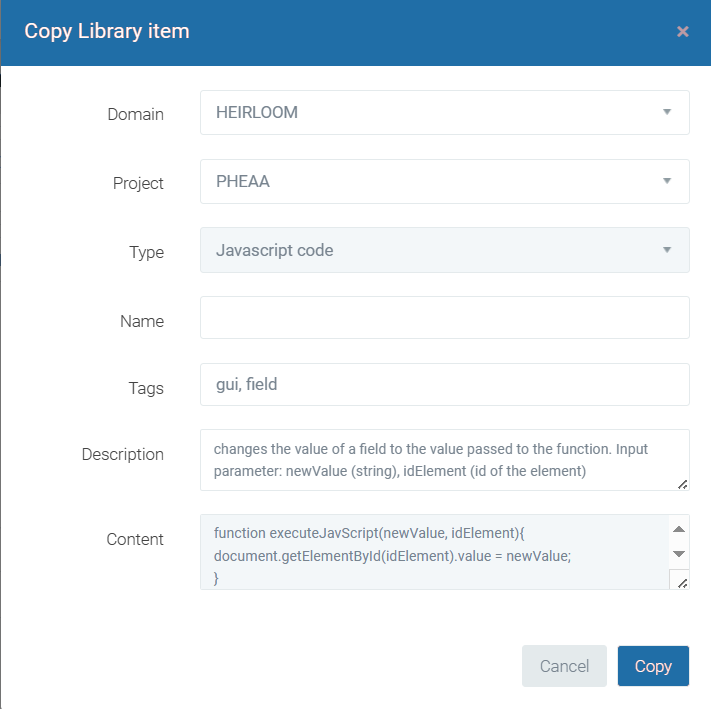
Copy a library item
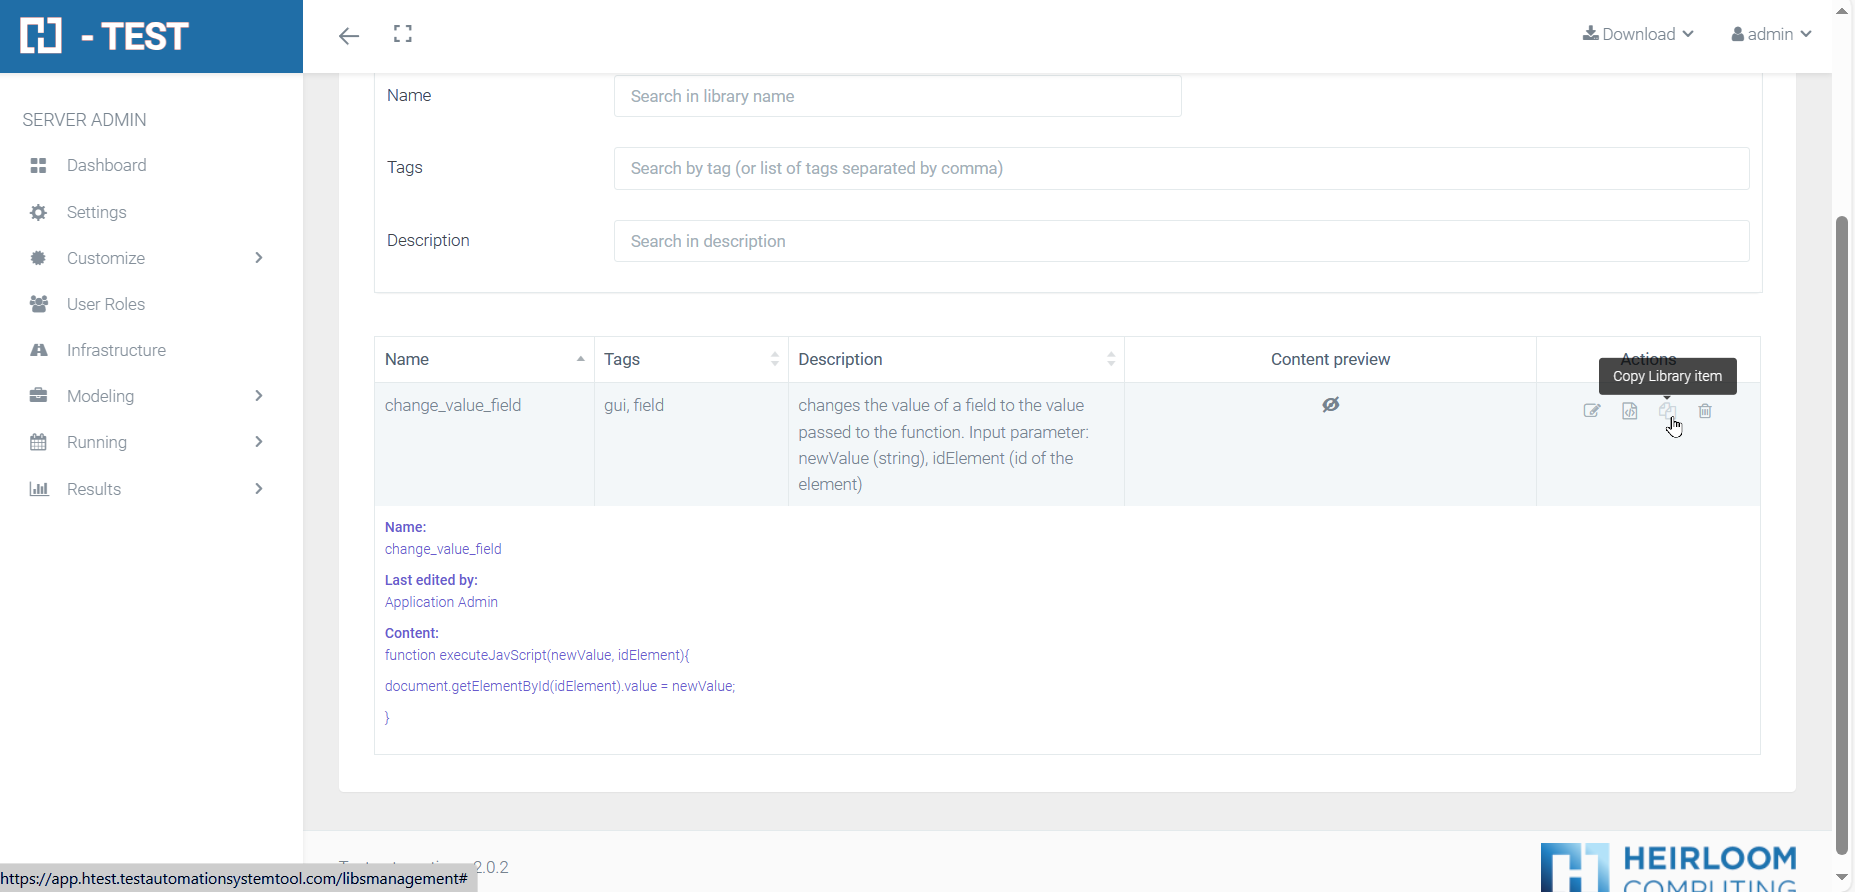
Clicking the Copy library item button in the Actions column displays a form to copy this item, for example to another domain or project, and allows you to modify certain fields such as Name, Tags or Description.
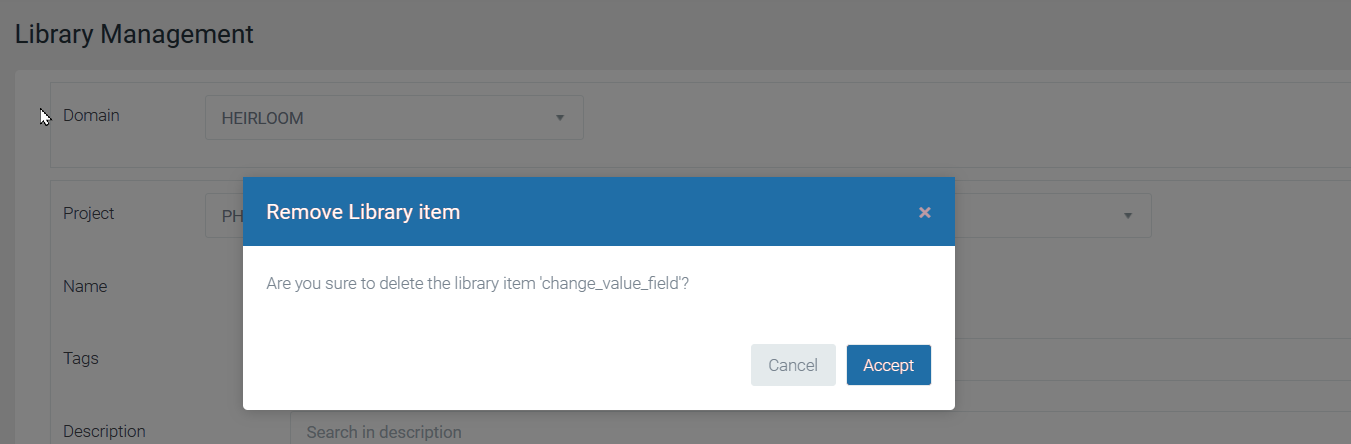
Remove a library item
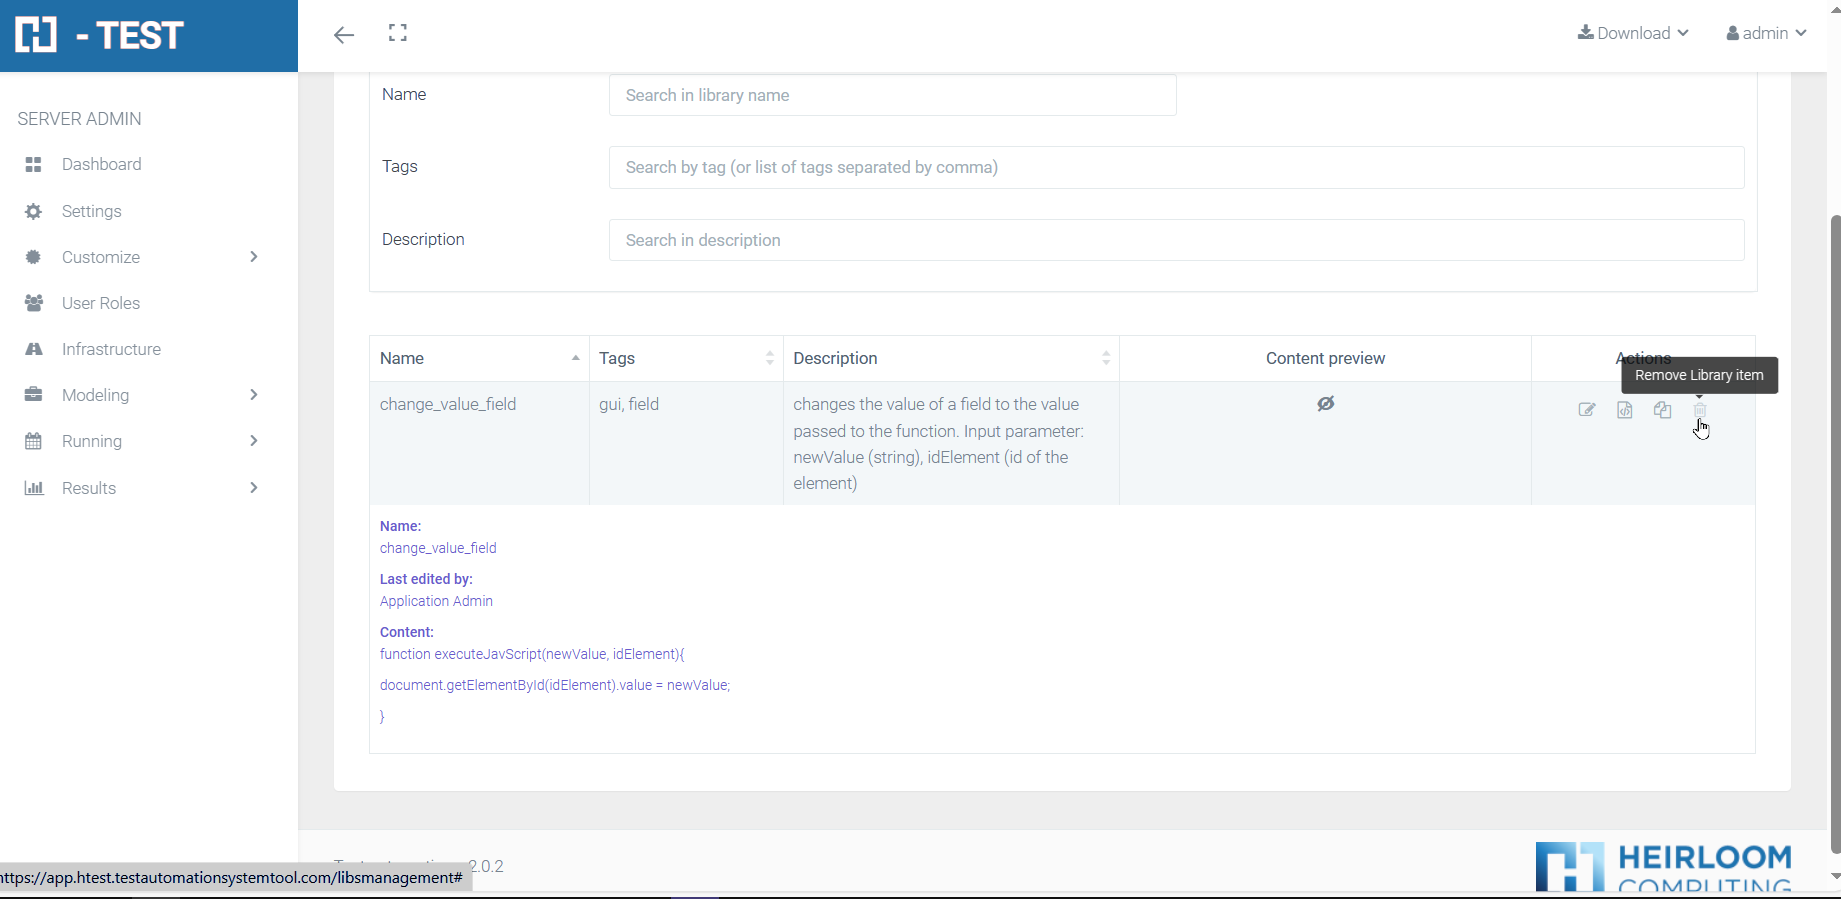
Clicking on the Remove library item button in the Actions column, a confirmation dialog appears to permanently delete this item.
Usability from Modeling
Accessing Library Management from Modeling
If you are modeling a diagram and need to browse the Javascript/Sql code in the libraries, you can do it in two ways:
Manually
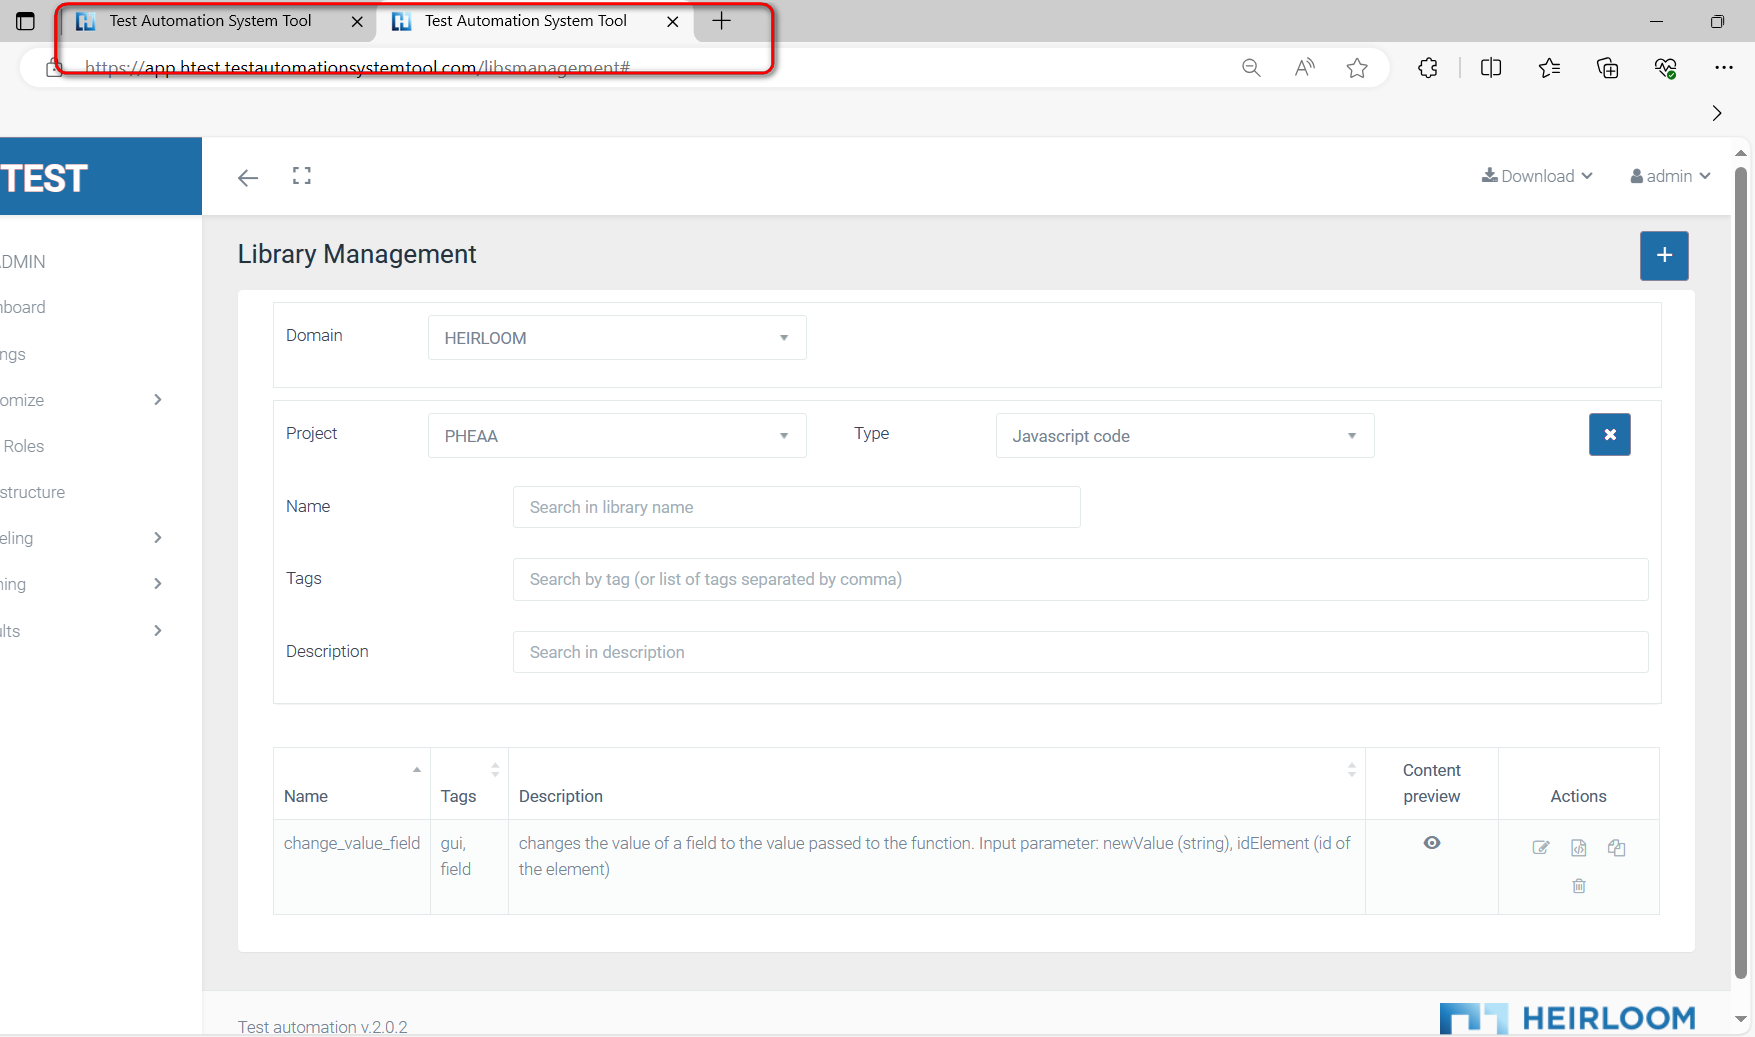
By opening a new TAST tab in your browser, where you will open the Library Management screen.
Automatically
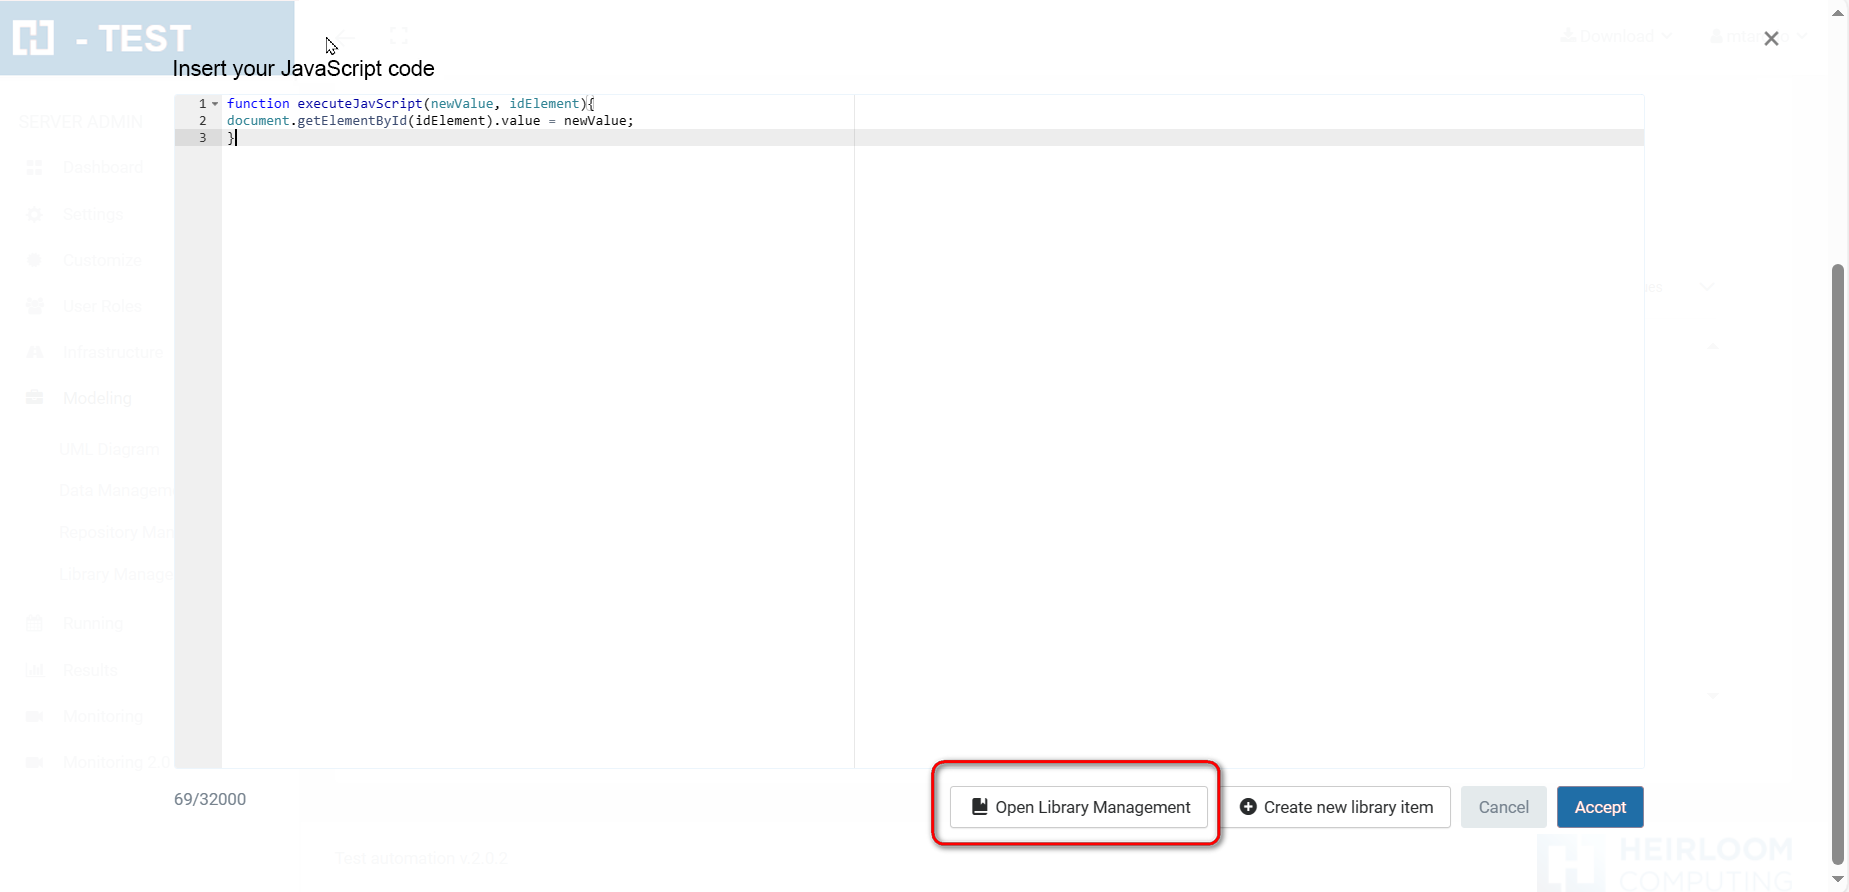
Clicking the "Open Library Management" button from the Modeling Javascript/Sql code editing window will automatically launch the Library Management page in a new tab of your browser.
Remember that the Javascript/Sql code editing window appears in Modeling when editing code in messages such as executeJavascript, or dbGetQueryData, for example.
Saving Javascript/Sql code from Modeling in a library
If you are modeling a diagram and want to save in a library the javascript/query sql code used in a given message, you can do it in two ways:
Manually
In the Library Management screen the user will create a new item, then copy the Modeling code and finally paste it into the Contents field of the new library item.
Automatically
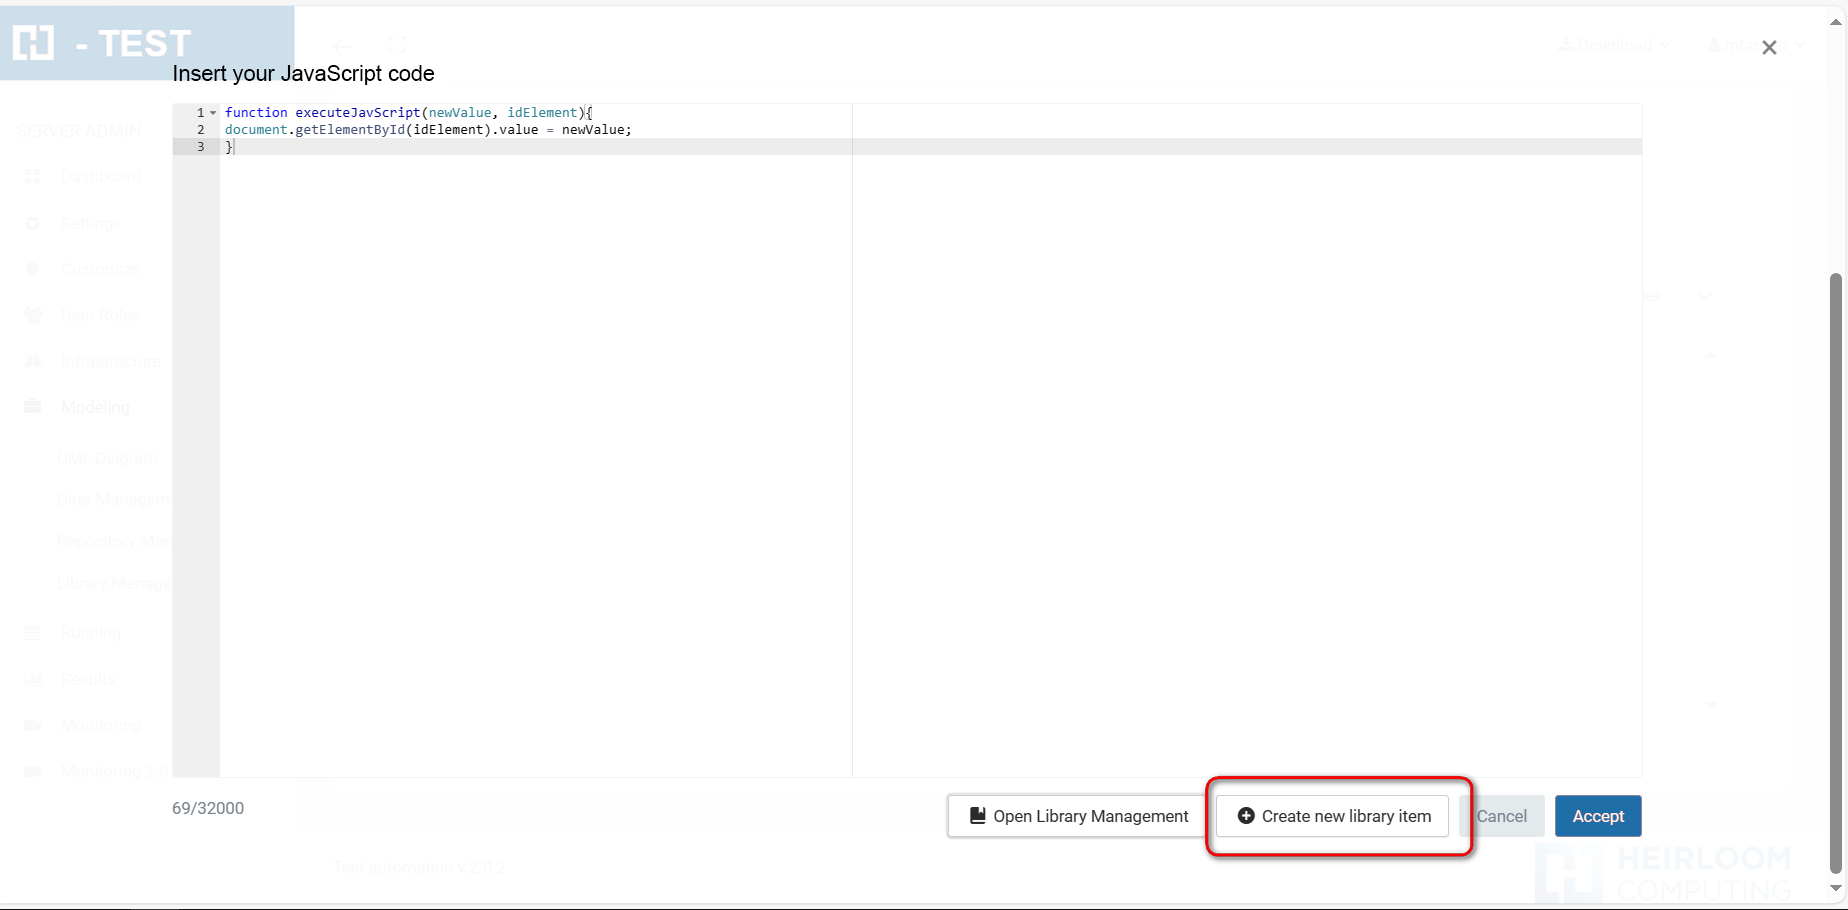
Clicking the "Create new library" item button from the Modeling Javascript/Sql code editing window, which will automatically launch the Library Management page in a new tab of your browser, with the Create new library item form open and with the Domain, Project, Type and Content fields already filled in.
IMAGE 1 IMAGE 2
Retrieve Javascript/Sql code from a library for use in Modeling
When a user is modeling a diagram and editing the javascript or sql code of a message, and would like to bring the code from one of the libraries, this is the way:
-
Open the Library Management screen in a new tab of your browser and locate the desired code, then copy the code,
-
and simply paste the code into the Modeling Javascript/Sql code editing window.
IMAGE 1 IMAGE 2